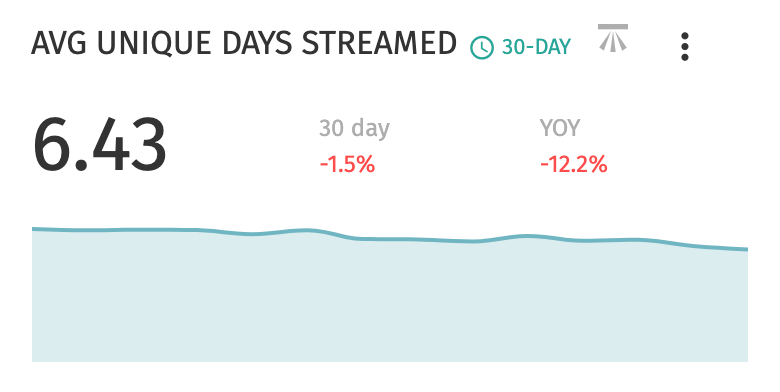
Avg unique days streamed
Subscriber loyalty is the holy grail for SVoD services. Having a great content offering is one of many ways to increase subscriber loyalty and pairing this with viewing data is a great strategy to win in a crowded market.
Avg Unique Days Streamed demonstrates the frequency of visits on average for each user over that past 30 days, with comparisons to the previous 28 days and year over year. This is a view into the loyalty of your average subscriber.
Keep subscribers coming back by maintaining a library of content that appeals to the viewing habits of your audience. Utilize strategies to deepen their engagement with your video service by guiding them to further content that is likely to keep them engaged and subscribed for the long-term. Understanding this relationship between your subscribers and the content they love is paramount to building a personal experience that reduces their propensity to churn.
Use your data to predict and recommend the next series or movie that your subscribers want to watch.
Users of the Insights Scorecard have access to the benchmark for Avg Unique Days Streamed.