Introduction
Audience insight data integrates your OTT (Over-the-Top) video data sources with subscription video insights to provide actionable insights based on key industry benchmarks. This includes:
- Unique insights - Increase audience lifetime value with unique audience insights for video businesses
- Data-driven results - Improve audience acquisition, service engagement, and reduce churn
- Customer success - Brightcove provides ideas and recommendations based on industry best practices
- At-risk subscriber identification - Churn prediction uses machine learning to identify subscribers who are at-risk of leaving your video service
From your audience insight scorecard, select the Summary tab to see a summary of customer metrics.
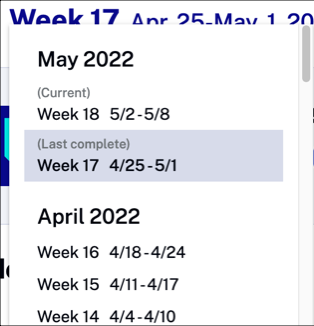
Expand the time span selector and choose a week for your reporting data.
Click cmd + p to print a copy of this report. Landscape is recommended.

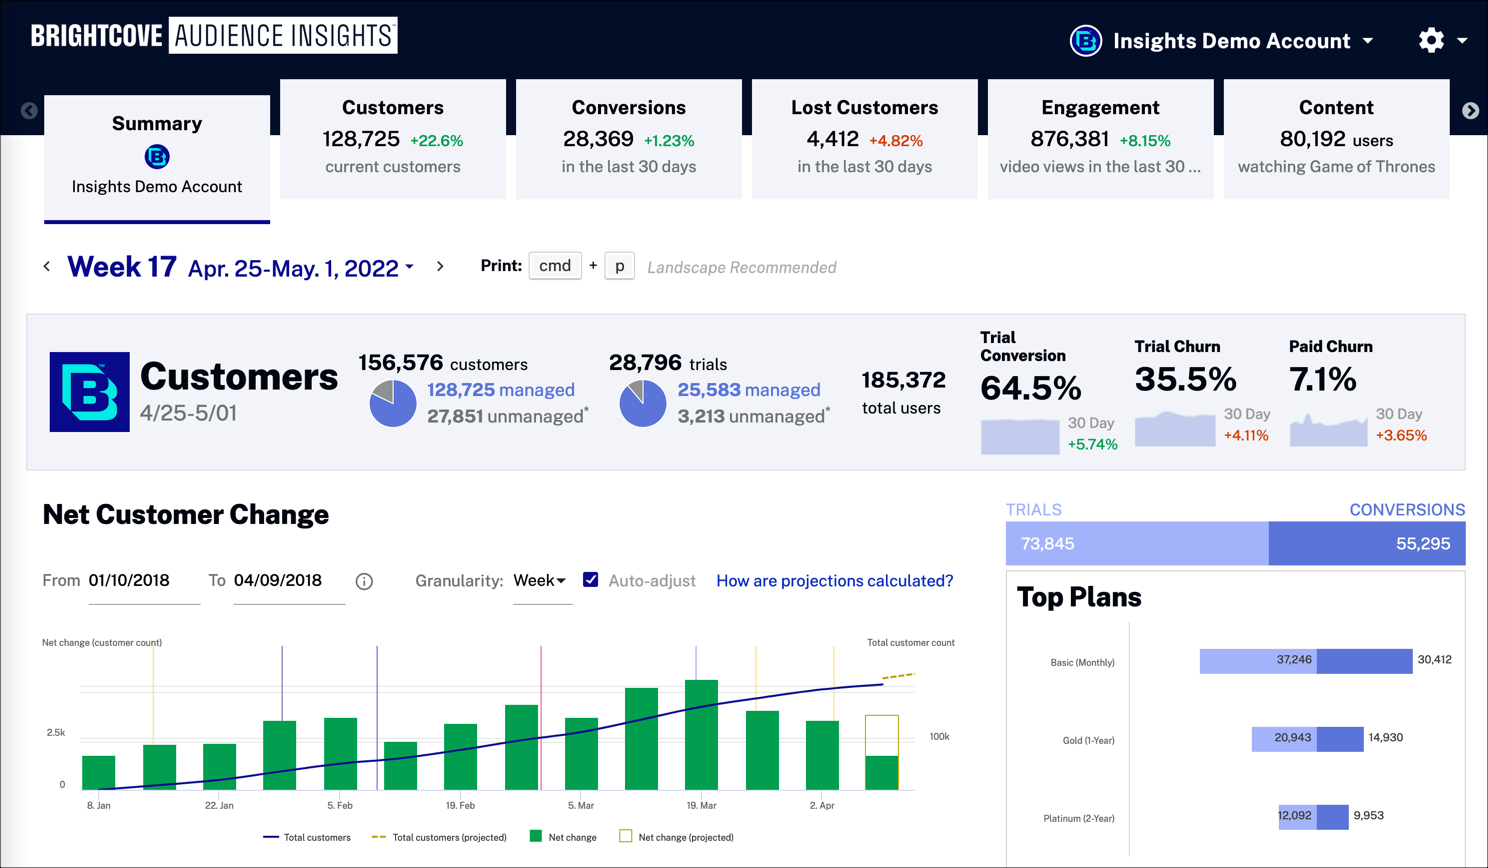
Customers
Customer metrics will help you gain insights into your marketing effectiveness.
Summary
Quickly view a summary of customer data for the selected week.
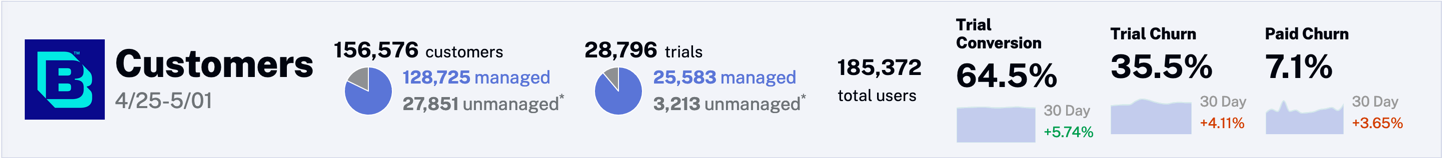
Review customer summary data:
- customers - Number of managed subscription users in relation to the number of unmanaged users
- trials - Number of managed/unmanaged users in a subscription trial period
- total users - Total number of customers with either a subscription package or a trial
- Trial Conversion - Number of customers who converted to a subscription after being on a trial
- Trial Churn - Number of customers who canceled their trial subscription
- Paid Churn - Number of customers who canceled their paid subscription
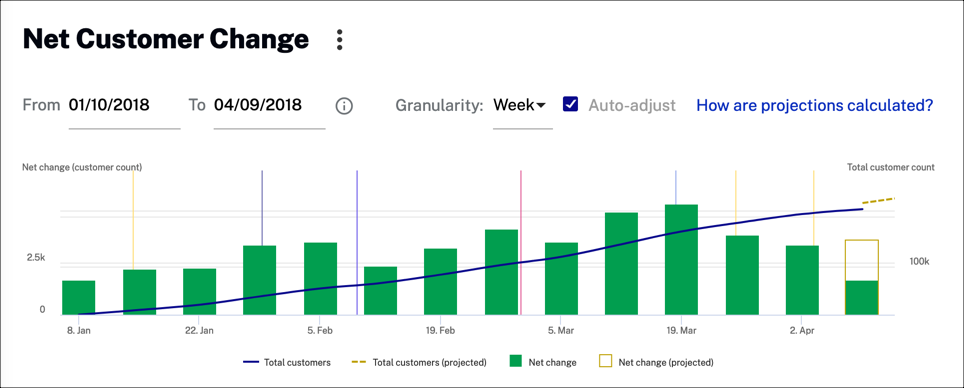
Net Customer Change
The graph below shows the total number of your customers and the net change over time.
Actions
You can select any of the following actions to change the data presented:
- Click
 to download customer change data as a CSV file or a PNG image.

- Select a date range for your data. Note that the date range should be 5 days or longer.

- Select the x-axis granularity to be Day, Week or Month.

- Check
 to automatically change the x-axis dimension.
Data
The following data is displayed in the graph:
- Total customers - Total number of subscription customers
- Total customers (projected) - Total projected number of customers
- Net change - Net change in total number of subscription customers
- Net change (projected) - Net projected change in total number of subscription customers
Customer Changes By Week
The table below provides information about customer changes by week.
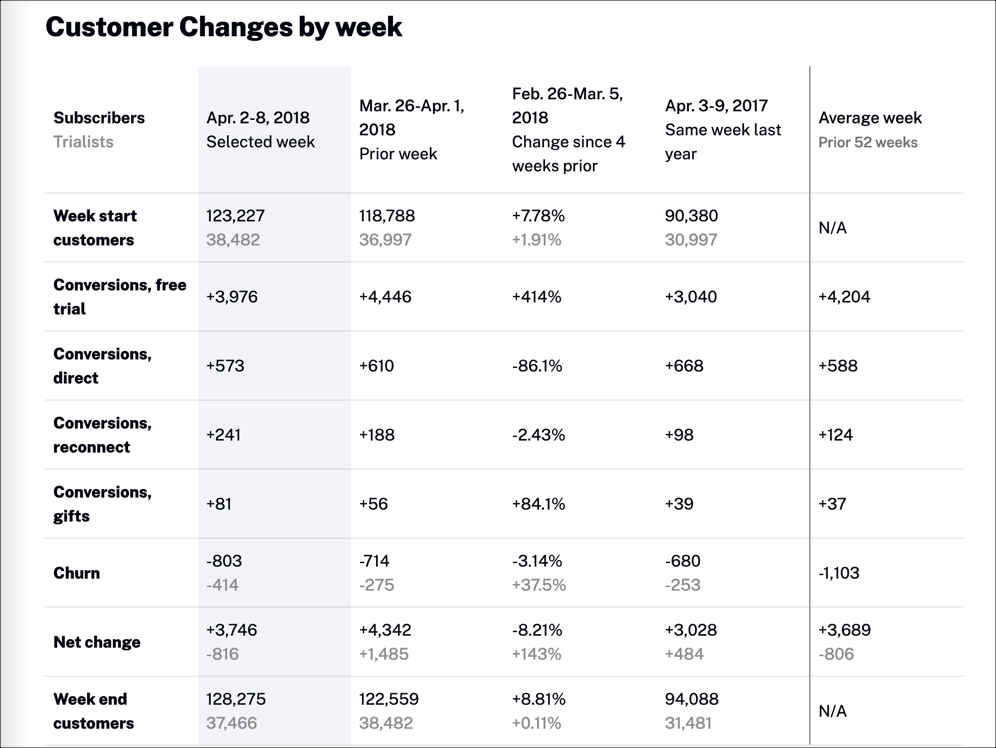
Data
The following data is displayed in the table:
- Subscribers - Subscribers include subscription customers and trial users
- Week start customers - Number of customers who started a subscription or trial at the start of each week
- Conversions, free trial - Number of customers who converted from a free trial to a paid subscription
- Conversions, direct - Number of customers who initially signed up for a paid subscription
- Conversions, gifts - Number of customers who signed up for a paid subscription after receiving promotional gifts
- Churn - Number of customers who canceled a paid subscription or free trial
- Net change - Difference between new customer starts and those who canceled (churn)
- Week end customers - Number of new customers at the end of each week
Customer Value
The following quick-view graphs provide insights into customer value over the past 30 days.
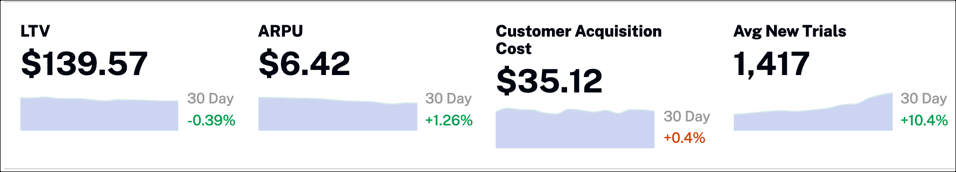
Data
The following data is displayed in the graphs:
- LTV - Lifetime value (LTV) estimates the amount of revenue a customer represents to a business over the life of the relationship; this is helpful for determining the cost efficiency of acquiring new customers and supporting them over time
- ARPU - Average revenue per unit (ARPU) is an indicator of profitability based on the amount of money generated from each user
- Customer Acquisition Cost -The cost of acquiring a single customer; this can include product, labor, marketing, and other costs
- Avg New Trials - Percentage of new trials compared to the total number of customers
Customer Count
The following graph shows your customer count for the last 30 days. Milestones are listed and presented in the graph using vertical, colored lines.
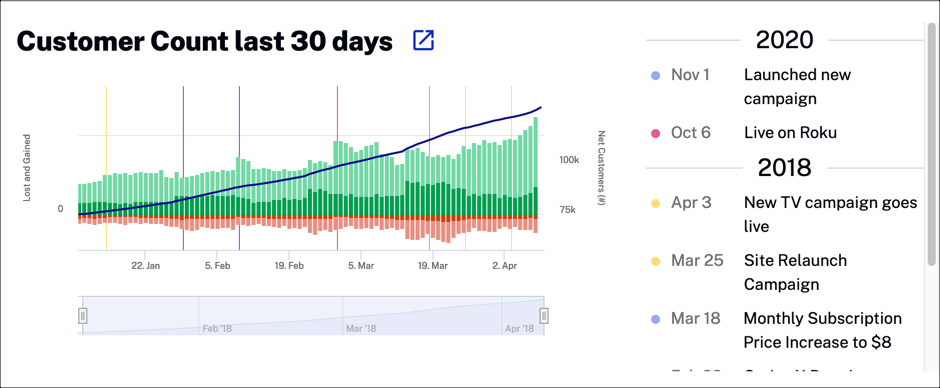
Actions
You can select any of the following actions to change the data presented:
- Click
 to open a new window with the ability to view data by these options:
- All Customers
- Plan
- Channel
- Device
- Country
- Click to download customer change data as a CSV file or a PNG image.
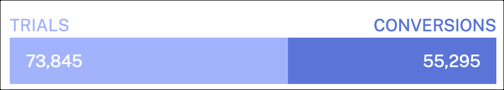
Trials and conversions
View the number of customers on trial plans versus those who have signed up for a subscription.
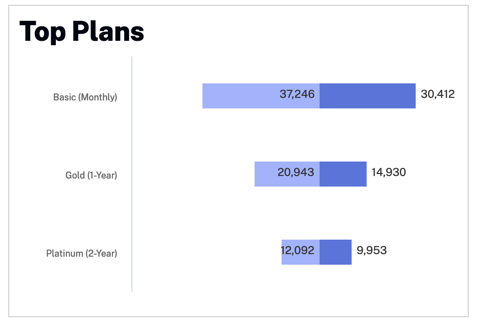
Top Plans
See trial and conversion data for the most popular subscription plans.
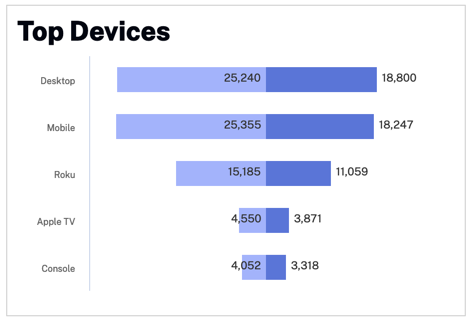
Top Devices
See trial and conversion data for the most popular devices.
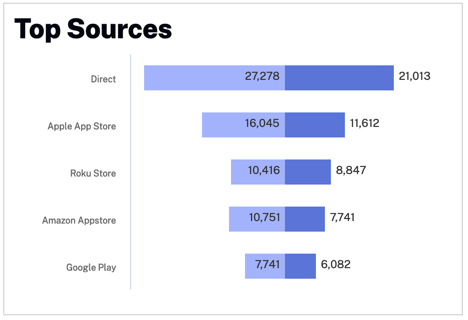
Top Sources
See trial and conversion data for the most popular sources.
Engagement
The following quick-view graphs provide insights into customer value for the selected week. It shows the number of views, active viewers, and a quick view of content performance.

Data
Graph data:
- Engagement - Timeframe for customer engagement data
- Total views - Total customer views for all of your content
- managed/unmanaged -Systems without user-specific data reporting (i.e. Amazon Channels) are unmanaged; data from these services are not presented in any charts
- Active Viewers - Percentage of the total number of viewers who were active in the last 30 days
- WAU/MAU Ratio - Weekly Active Users (WAU) as a percentage of Monthly Active Users (MAU); active users are defined as being signed in
- Avg Hours Streamed - The average number of hours streamed for a user
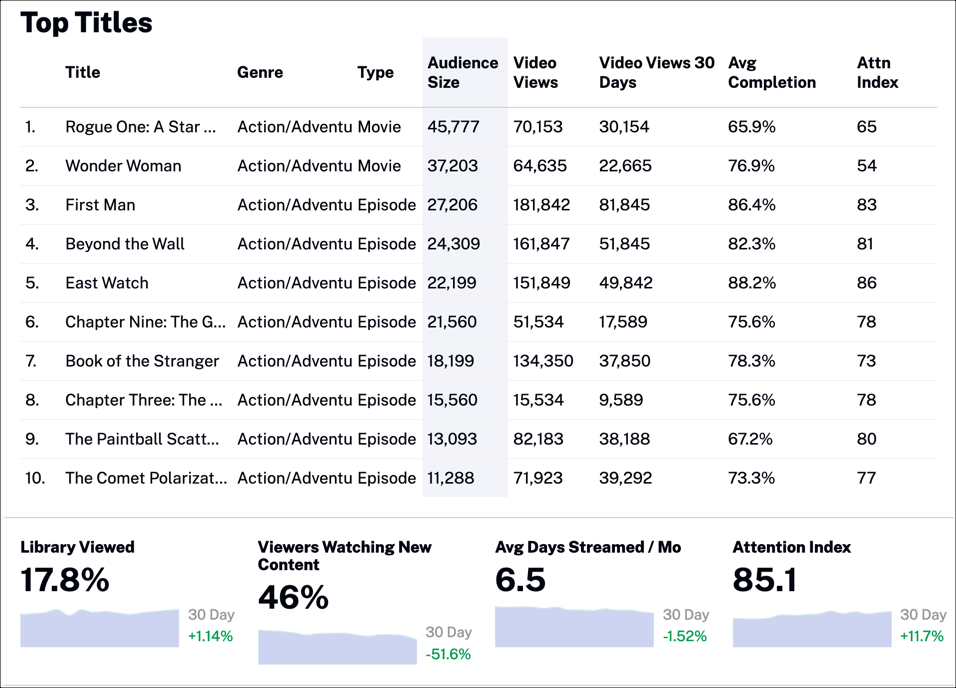
Top Titles
This table shows which titles in your content library are driving the most traffic.
Data
Table data:
- Title - Title of the content viewed
- Genre - Stylistic or thematic category for grouping video content
- Type - Type of video content or group of content; values are Series, Season, Episode, Movie
- Audience Size - Number of unique viewers
- Video Views - Number of times a video started playing, recorded when the stream is started (does not include rewind or replay); it is not a measure of individual viewers
- Video Views 30 Days - Number of video views for the past 30 days
- Avg Completion - Average percentage of the amount of video content viewed by each user
- Attn Index -
Graph data:
- Library Viewed - Percentage of your video library viewed by all customers
- Viewers Watching New Content - Percentage of viewers watching new video content
- Avg Days Streamed / Mo - Average number of days streamed per user for the past 30 days
- Attention Index -
Top Series, Movies, Genres, Live channels
These tables show the top series, movies, genres, and live channels based on video views.
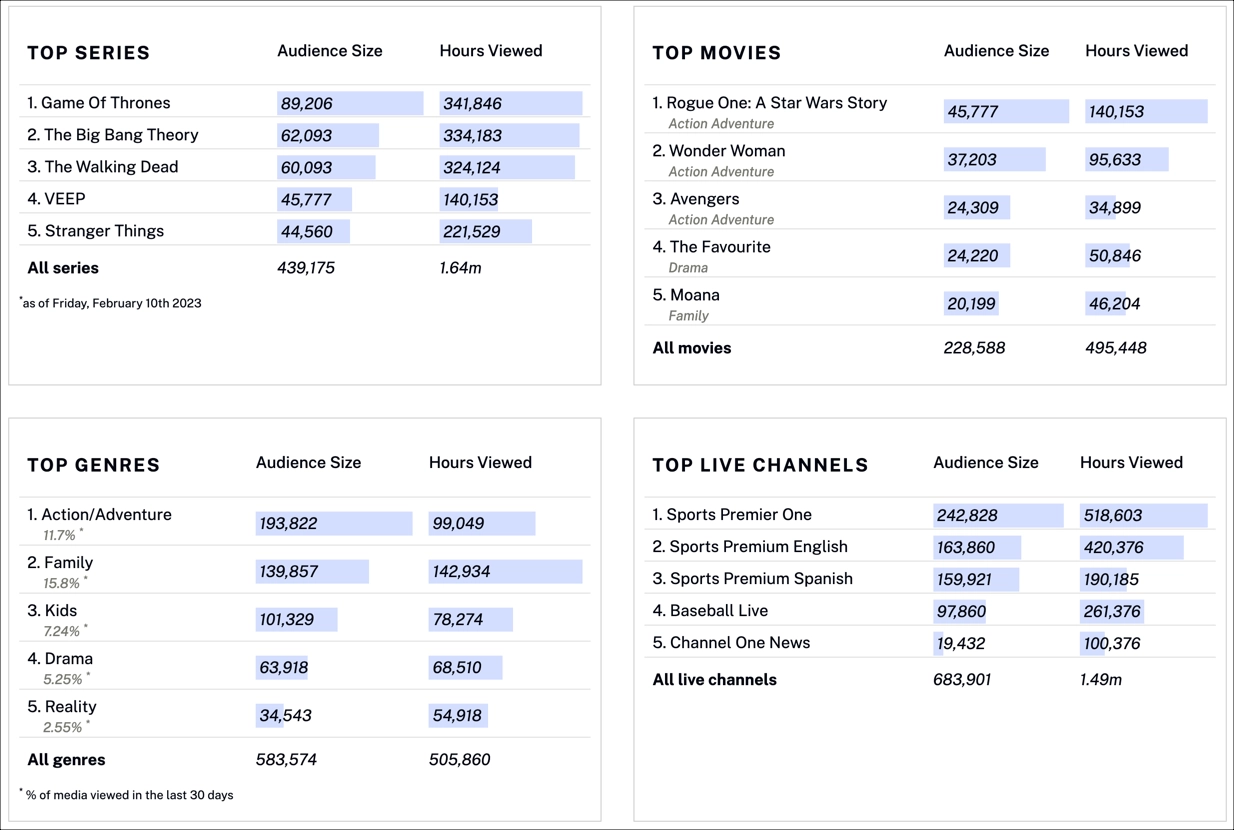
Data
Table data:
- Audience Size - Total number of viewers
- Hours Viewed - Total number of hours viewed by all viewers
Hours Viewed by Device
See which devices are most popular by your viewers.

Data
Graph data:
- Hours Viewed - Number of hours viewed by device
- Audience Size - Number of viewers by device
- Device - Device used by viewers to watch your content; includes desktop, phone, Roku, Apple TV, other TV