Introduction
Audience insight data integrates your OTT (Over-the-Top) video data sources with subscription video insights to provide actionable insights based on key industry benchmarks.
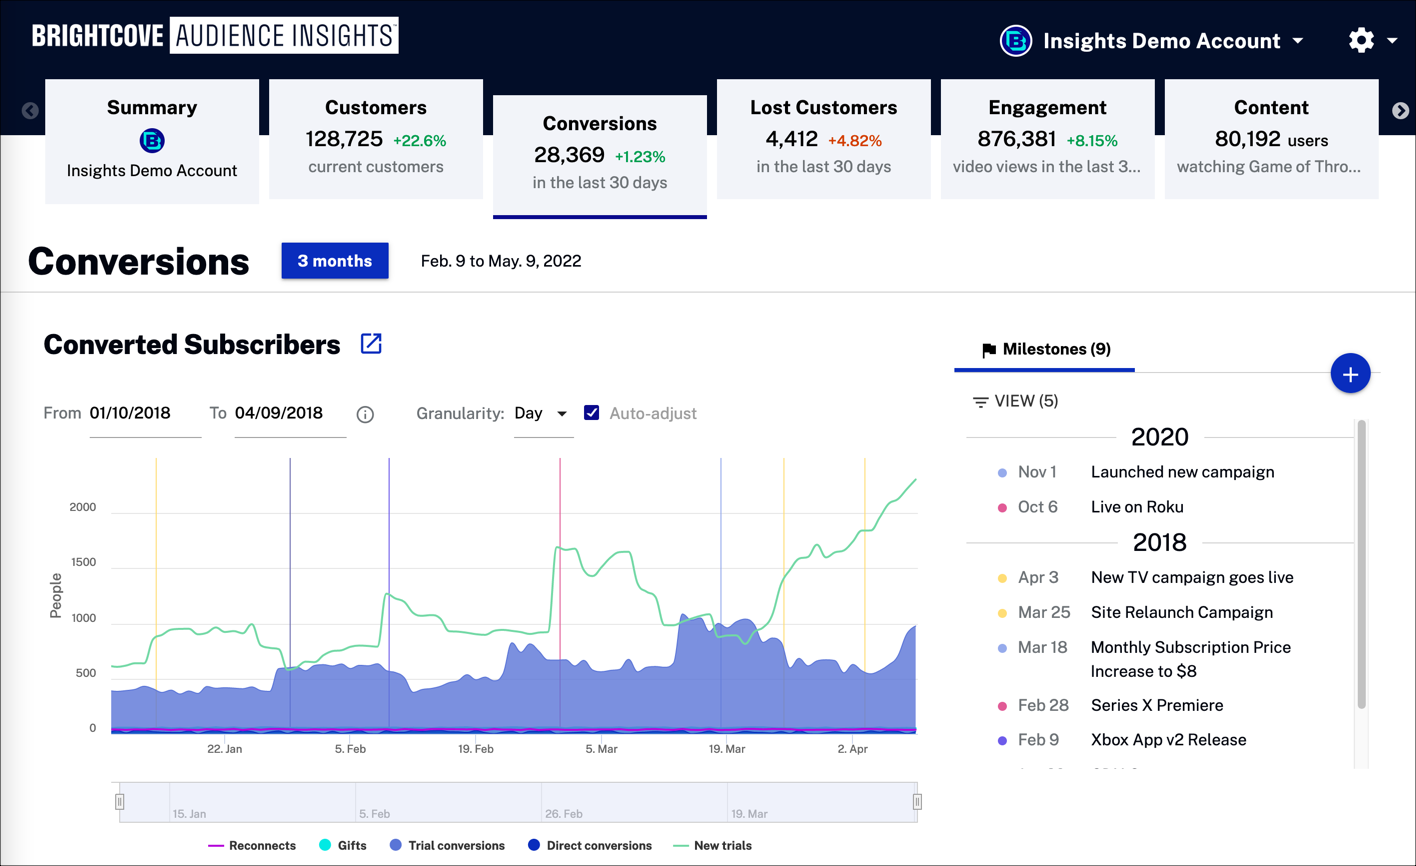
From your Audience Insight scorecard, select the Conversions tab to see data for your converted subscribers.
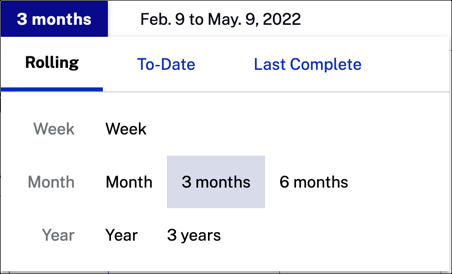
Click  to select a timeframe for your conversion data.
Converted Subscribers
View data for converted customers and learn about the effectiveness of gifts, trials and direct marketing. Create milestones and track how they impact conversions.
Actions
You can select any of the following actions to change the data presented:
-
Click
 to filter customer data by:
- All Conversions
- Plan
- Channel
- Device
Country
-
Click
 to download customer change data as a CSV file or a PNG image.
Select a date range for your data. Note that the date range should be 5 days or longer.

Select the x-axis granularity to be Day, Week or Month.

- Check
 to automatically change the x-axis dimension.
Data
Hover over the graph to display data, including milestones:
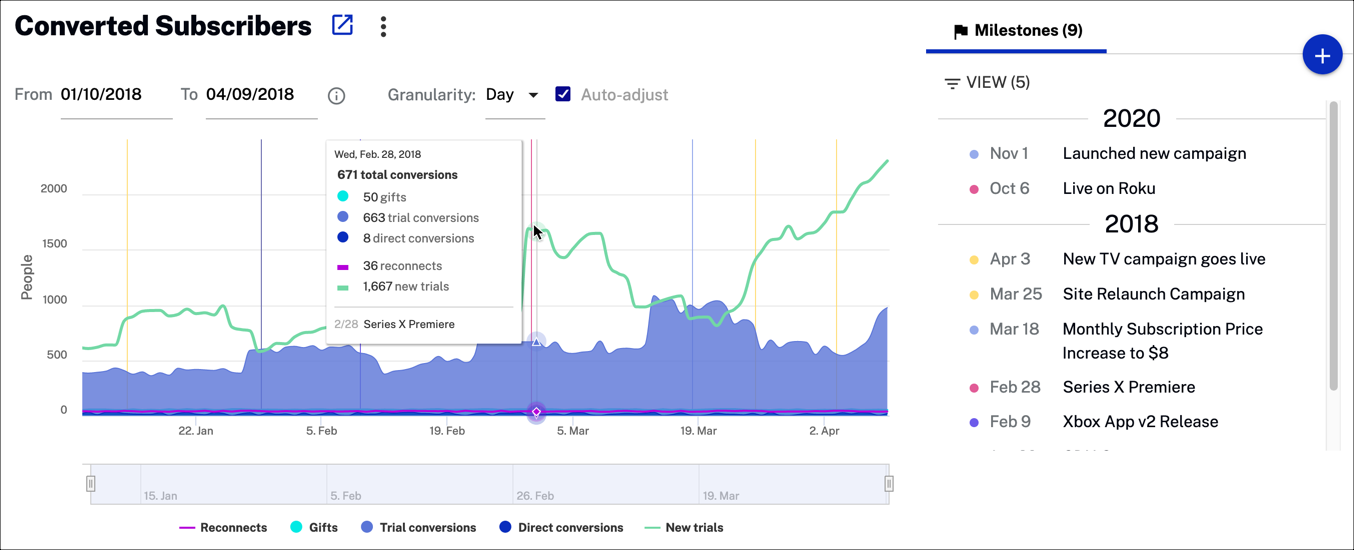
- Reconnects - Number of previous customers who have signed up again for a subscription
- Gifts - Number of customers who have received a promotional gift
- Trial conversions - Number customers who became subscribers after a trial period
- Direct conversions - Number customers who became subscribers when they initially signed up
- New trials - Number customers starting a new trial
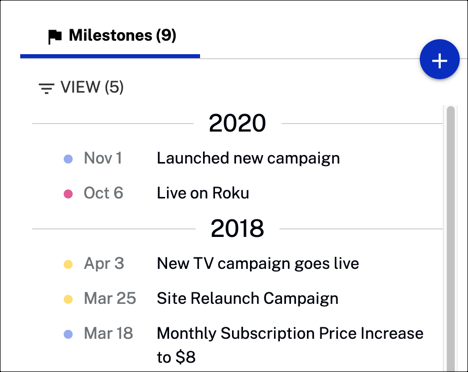
Milestones
Create a milestone to track how it effects your converted subscribers.
Actions
You can select any of the following actions:
- Click View to filter data by:
- Operations
- Product
- Business
- Content
Marketing
-
>Click
 to create a new milestone. Fill in the form fields and select ADD when complete.
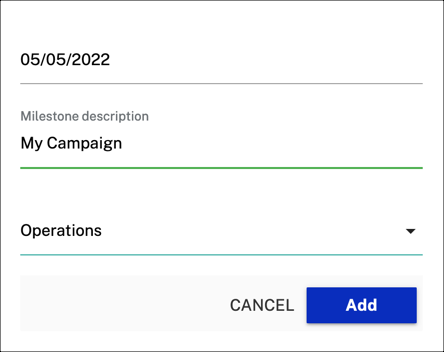
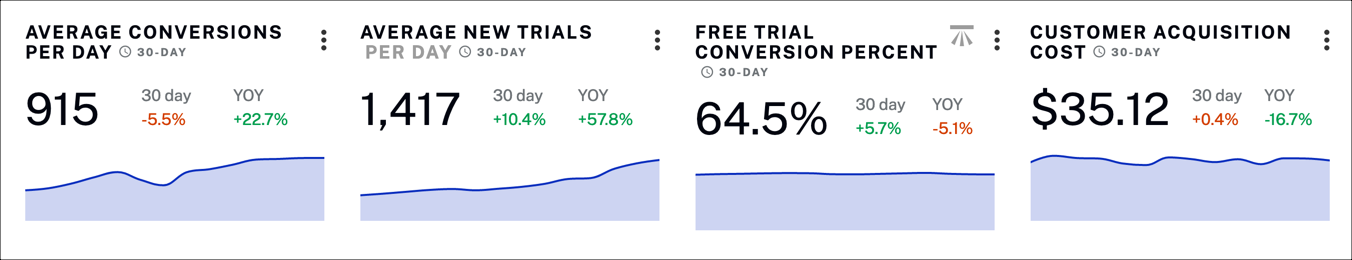
Conversion Value
Track your customer conversion rate over time along with your customer acquisition cost.
Actions
The following actions are available:
- Click next to each graph to download the associated data as a CSV file.
Click
 to view benchmark data.
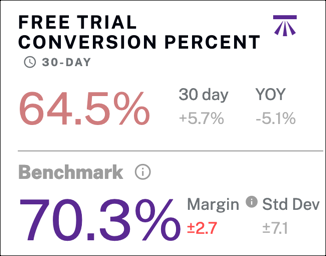
Data
Hover over any of the graphs to see data associated with a weekly time range.
- Average Conversions By Day - Average number of customers who converted to a subscription per day for the last 30 days
- Average New Trials - Average number of new trial sign-ups per day for the last 30 days
- Free Trial Conversion Percent - Ratio of average free trial conversions divided by paid subscriptions for the last 30 days
- Customer Acquisition Cost - Ratio of sales and marketing expenses divided by gross customer additions
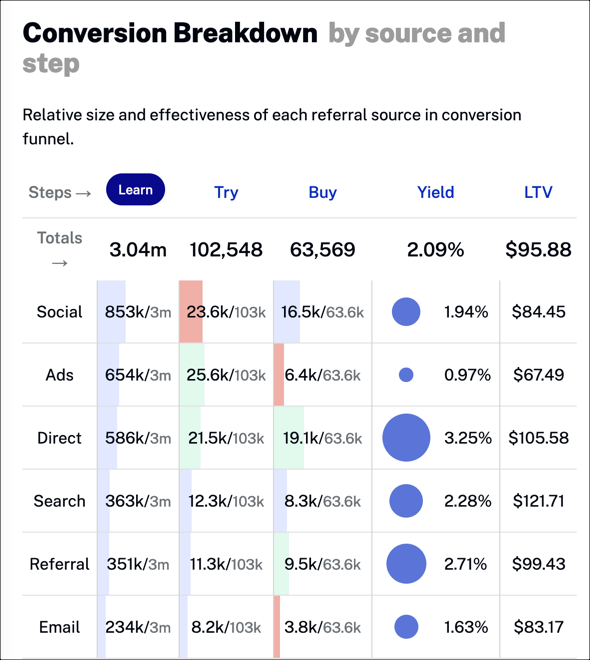
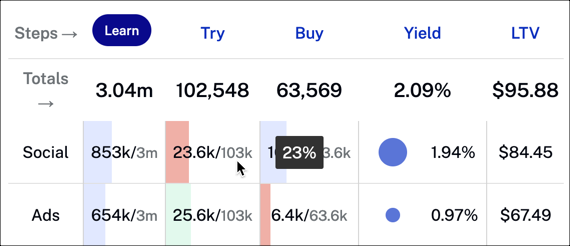
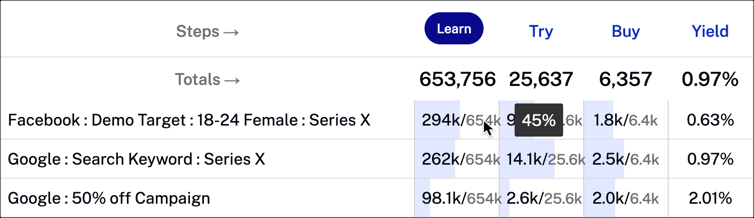
Conversion Breakdown By Source And Step
See the relative size and effectiveness of each referral source for converting customers to subscribers.
Actions
The following actions are available:
Click a step to sort the column in descending order.

Data
Hover over the data in the table to see the percentage.
- Learn - Number of customers who learn about your platform and sign up as a registered user
- Try - Number of customers who enroll in a free trial
- Buy - Number of customers who enroll in a paid subscription
- Yield - The rate of return calculated by dividing the amount of revenue received by the investment spent to acquire the customer
- LTV - Lifetime value (LTV) estimates the amount of revenue a customer represents to a business over the life of the relationship; this is helpful for determining the cost efficiency of acquiring new customers and supporting them over time
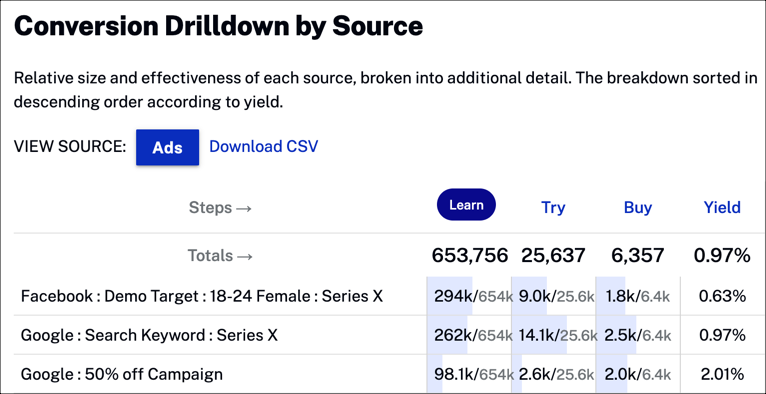
Conversion Drilldown By Source
View additional details for each referral source for relative size and effectiveness.
Actions
The following actions are available:
-
Click
 to select the referral source for the data displayed.
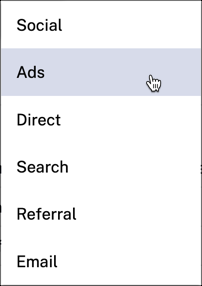
Click
 to download conversion data as a CSV file.
Click a step to sort the column in descending order.

Data
Hover over the data in the table to see the percentage.
- Learn - Number of customers who learn about your platform and sign up as a registered user
- Try - Number of customers who enroll in a free trial
- Buy - Number of customers who enroll in a paid subscription
- Yield - The rate of return calculated by dividing the amount of revenue received by the investment spent to acquire the customer
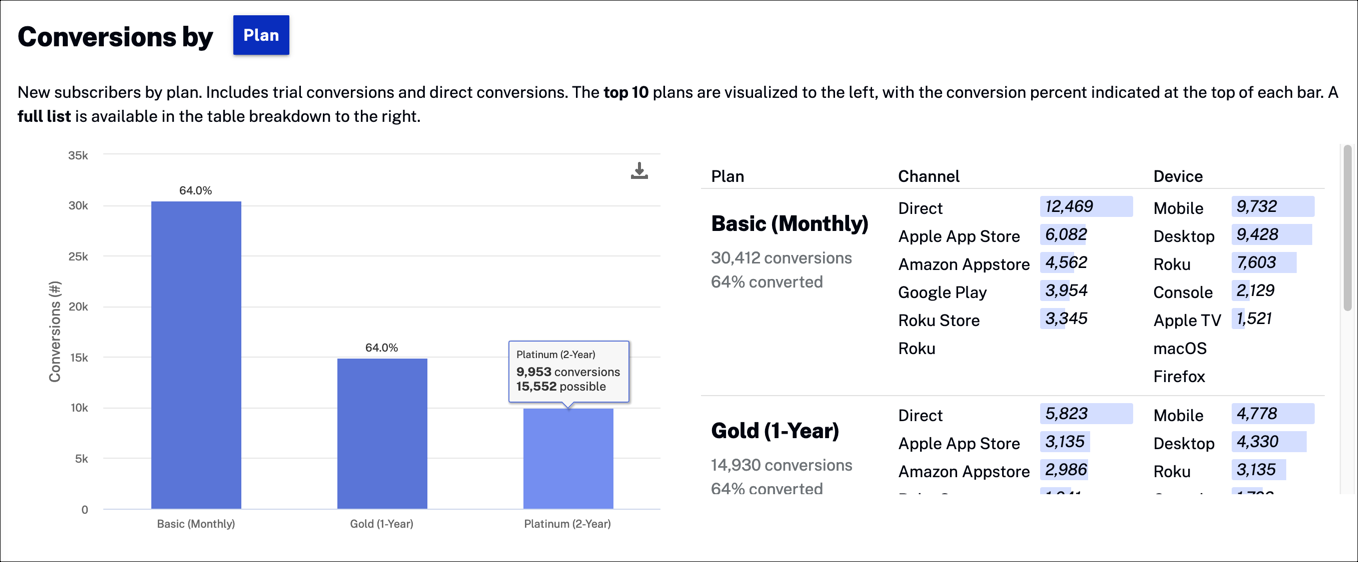
Conversions By Category
View the number of new subscribers by plan, including trial and direct conversions. The top 10 plans are shown in the graph, with a full list of plans shown in the table to the right of the graph.
Actions
The following actions are available:
-
Click
 to select the category for the data displayed.
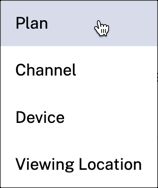
-
Click
 to download conversion graph as a PNG image or PDF.
Data
Hover over the graph to display data.
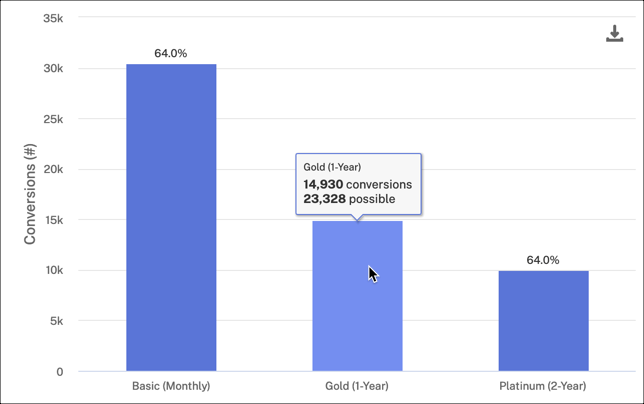
- Conversions - Number of new subscribers by category
- Possible - Number of potential customers who can be converted to be subscribers
- % converted - Percentage of new subscribers divided by total number of customers
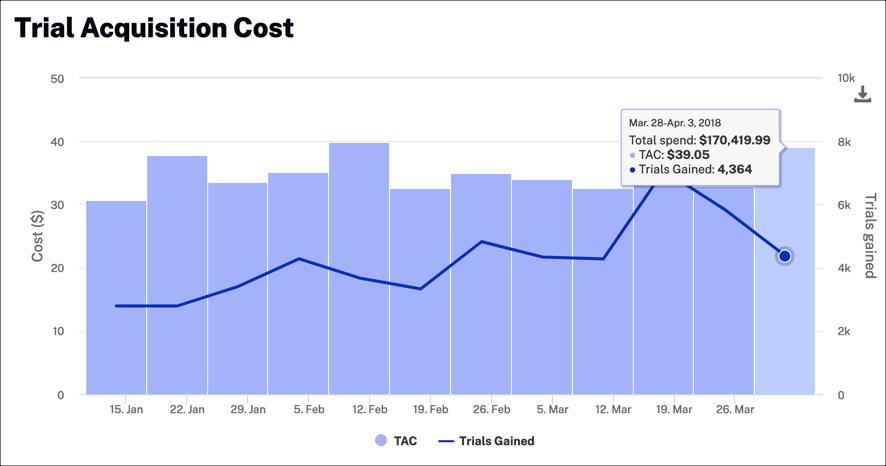
Trial Acquisition Cost
View the amount spent for trials, the number of customers converted to subscribers, and customer acquisition cost.
Actions
The following actions are available:
-
Click
to download conversion graph as a PNG image or PDF.
Data
Hover over the graph to display data.
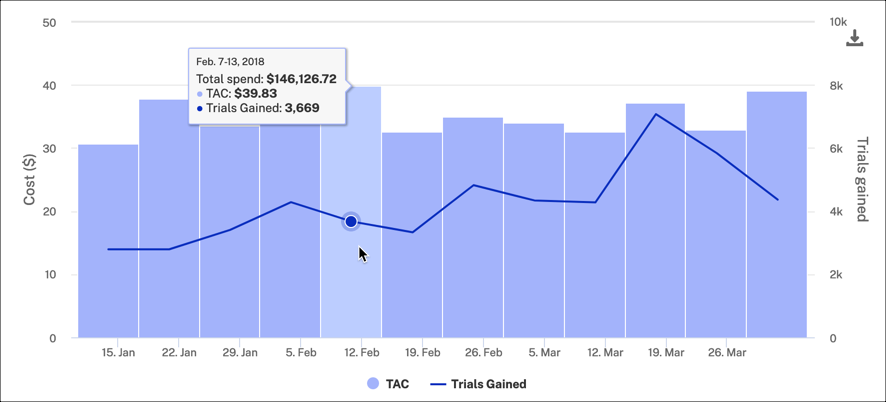
- Total Spend - Total amount spent on trial subscriptions over time
- TAC - Total acquisition cost per customer
- Trials Gained - Number of trials that have converted to paid subscription over time