Introduction
Audience insight data integrates your OTT (Over-the-Top) video data sources with subscription video insights to provide actionable insights based on key industry benchmarks.
From your Audience Insight scorecard, select the Distribution tab to see data for the distribution of third-party subscriptions.
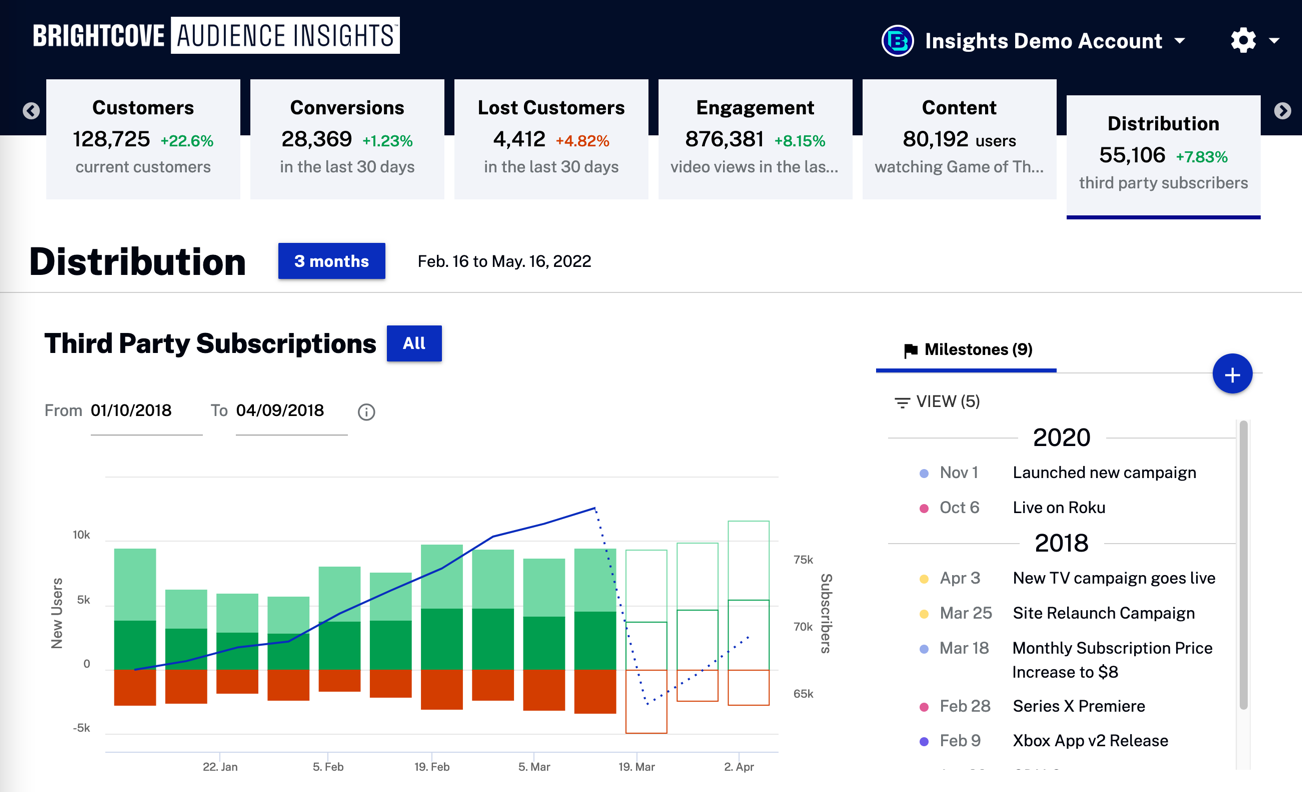
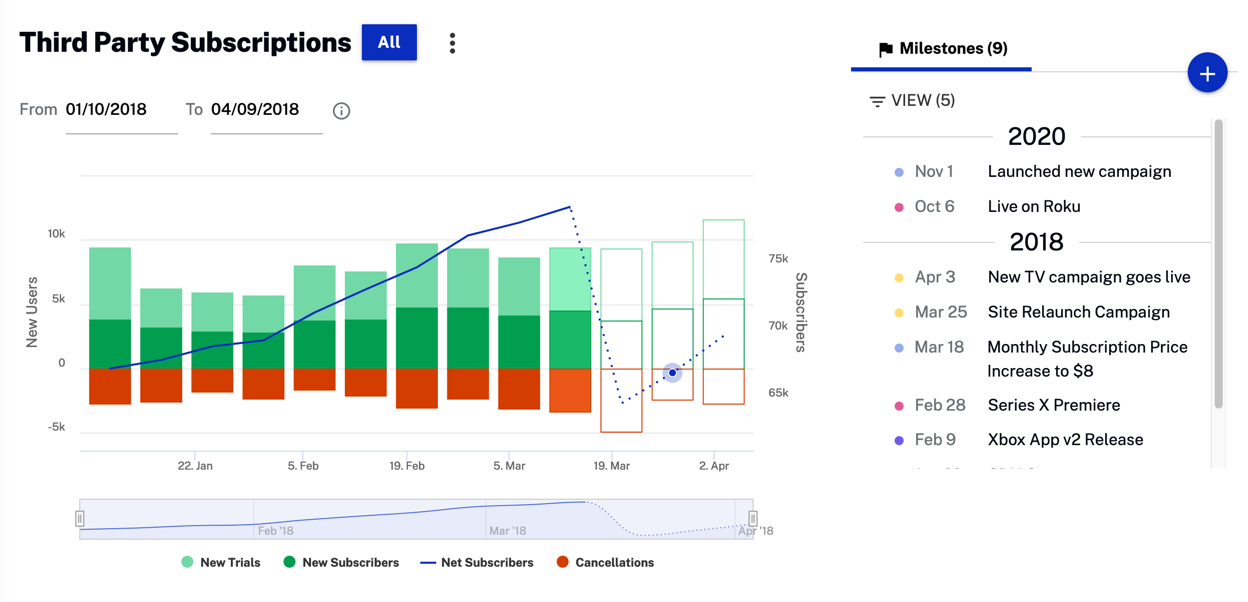
Third-Party Subscriptions
View data for subscribers on third-party platforms, including the Roku Store, Google Store, Apple store, and Amazon Prime Channel.
Actions
Here are the available actions:
-
Click
 to filter subscriber data by:
- All
- X1 Apps
- Roku Store
- Google Store
- Apple Store
Amazon Prime Channel
-
Click
 to download subscription data as a CSV file or a PNG image.
Select a date range for your data. Note that the date range should be 5 days or longer.

Data
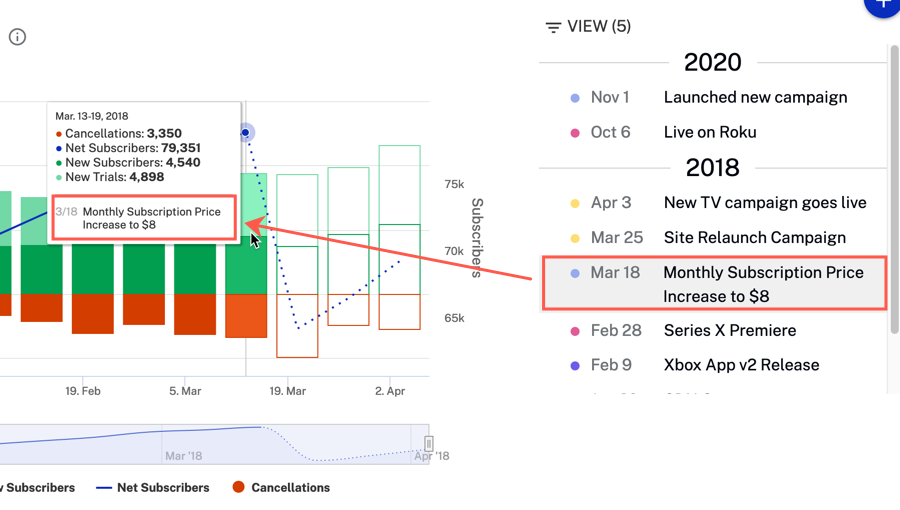
Hover over the graph to display data, including milestones:
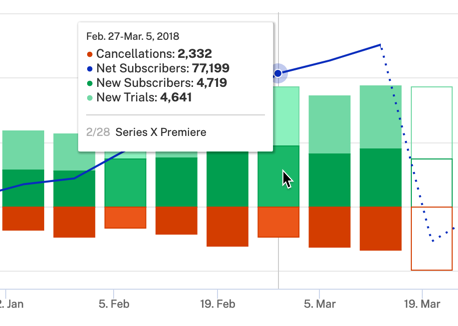
- New Trials - Number of new trial subscriptions on a third-party platform
- New Subscribers - Number of new subscriptions on a third-party platform
- Net Subscibers - New subscriptions minus cancellations
- Cancellations - Number customers who have cancelled their subscrition on a third-party platform
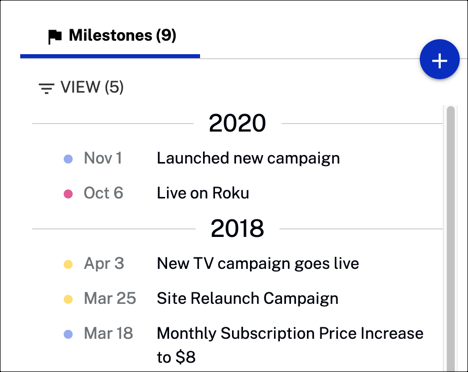
Milestones
Create a milestone to track how it effects your converted subscribers.
Actions
You can select any of the following actions:
- Click View to filter data by:
- Operations
- Product
- Business
- Content
Marketing
-
>Click
 to create a new milestone. Fill in the form fields and select ADD when complete.
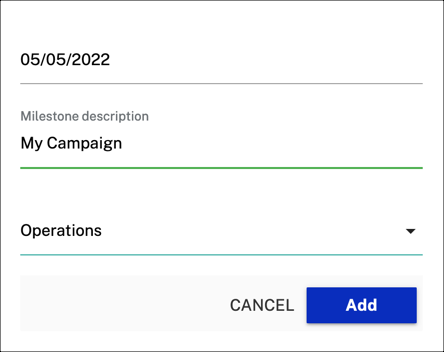
-
Hover over a milestone entry to see its position in the graph. Hover over the graph to see the corresponding data.
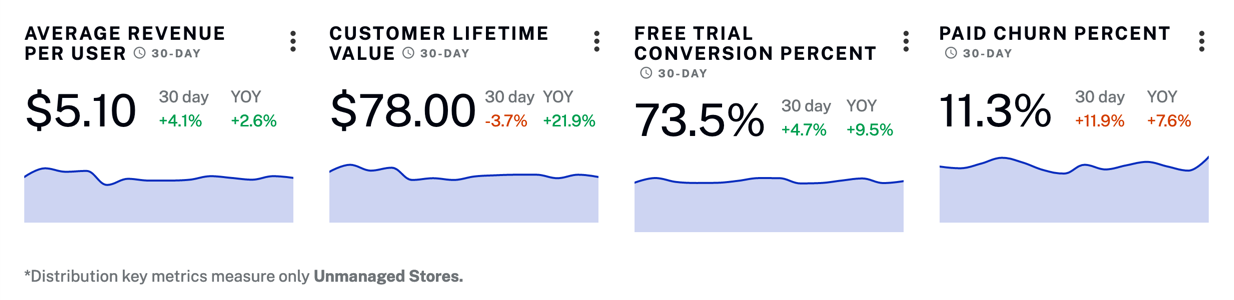
Customer Value
View customer data including average revenue and value for the last 30 days.
Actions
Here are the available actions:
-
Click
to download subscription data as a CSV file or a PNG image.
Data
Hover over the graph to display data.
- Average Revenue Per User - Subscription revenue divided by Average number of subscribers for the given time period
- Customer Lifetime Value - Lifetime value of a new customer, based on the survival rates of customers over the last year
- Free Trial Conversion Percent - Average free trial conversion to paid subscription for the last 30 days
- Paid Churn Percent - The percentage of the subscriber base that has cancelled over the last 30 days
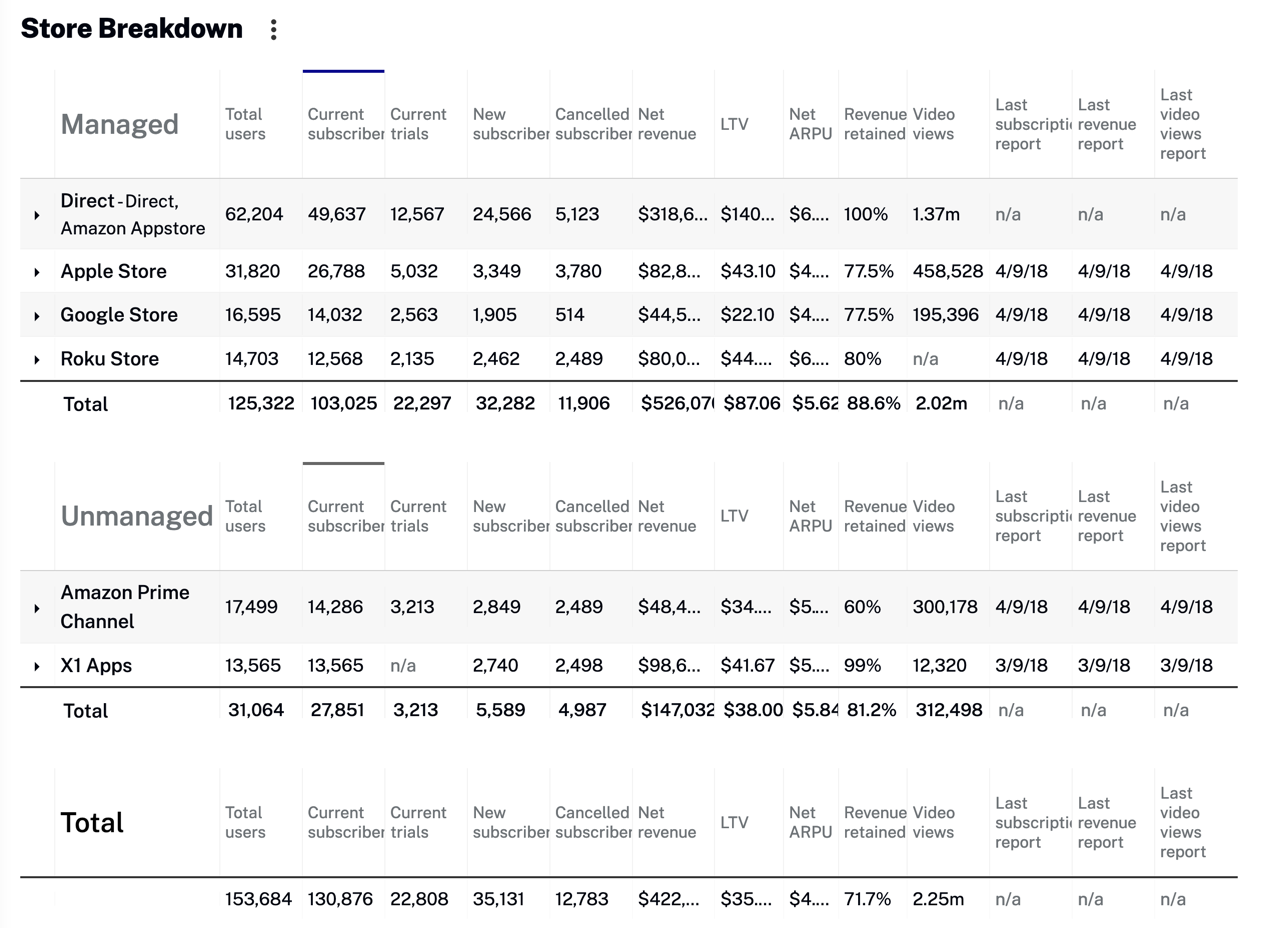
Store Breakdown
View customer metrics for each of your managed and unmanaged app stores.
Actions
Here are the available actions:
-
Click
to download subscription data as a CSV file or a PNG image.
-
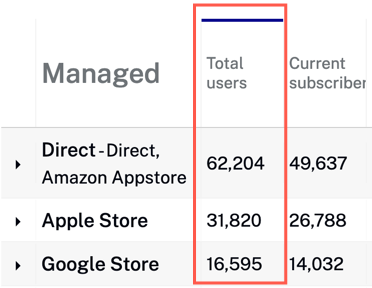
Click a table column to sort either ascending or descending.
-
Click
 to expand row details.
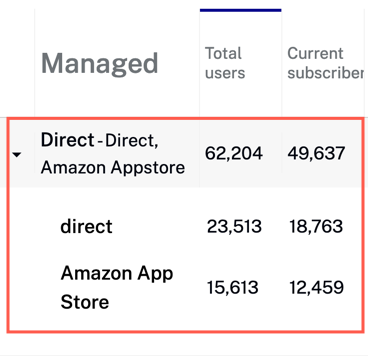
Data
Hover over the graph to display data.
- Total users - Total number of users
- Current subscribers - Number of users who currently have a subscription
- Current trials - Number of users who currently have a trial
- New subscribers - Number of users who enrolled in a paid subscription within the selected timeframe
- Cancelled subscribers - Number of users who cancelled their subscription within the selected timeframe
- Net revenue - Total income generated from subscriptions minus costs associated with subscriptions
- LTV - Lifetime value (LTV) estimates the amount of revenue a customer represents to a business over the life of the relationship; this is helpful for determining the cost efficiency of acquiring new customers and supporting them over time
- Net ARPU - Average revenue per unit (ARPU) is an indicator of profitability based on the amount of money generated from each user
- Revenue retained - Percentage of revenue retained from existing customers including expansion, downgrades, and cancellations
- Video views - Number of times a video started playing, recorded when the stream is started (does not include rewind or replay) - this is not a measure of individual viewers
- Last subscription report - Date for when the last subscription report was generated
- Last revenue report - Date for when the last revenue report was generated
- Last video views report - Date for when the last video views report was generated
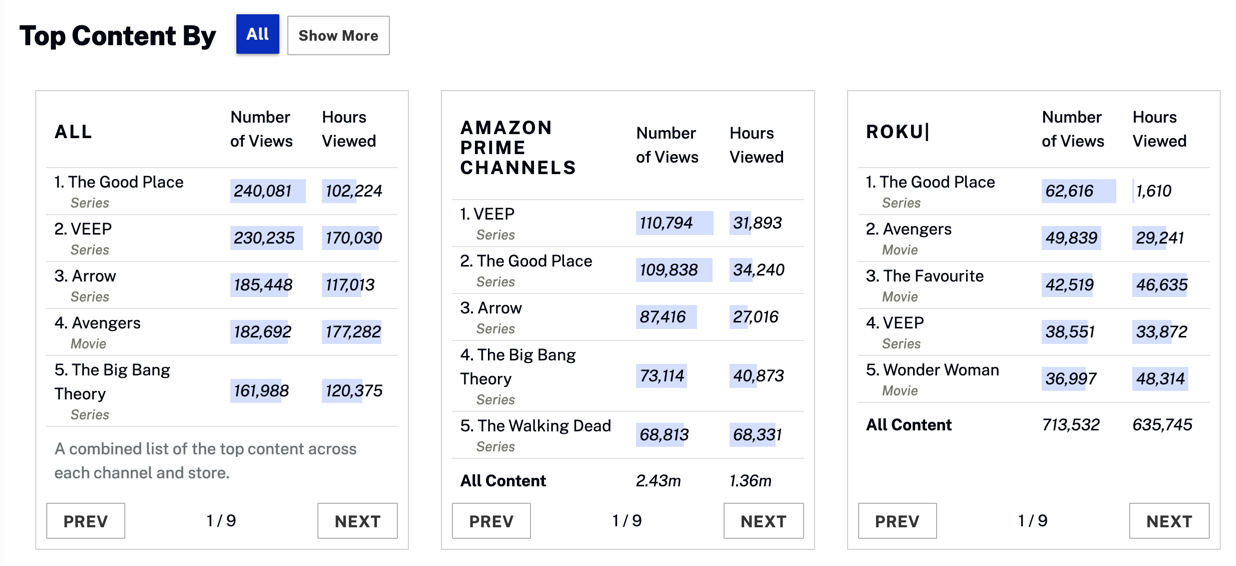
Top Content By Category
See your top viewed content by category, including All, Series, or Movie.
Actions
Here are the available actions:
-
Click
to filter subscriber data by:- All
- Series
Movie
-
Click
 to display an additional amount of data.
Data
Hover over the graph to display data.
- Media name - Name of the Series or Movie
- Store name - Name of the app store where the content was viewed
- Number of views - Number of times a video started playing, recorded when the stream is started (does not include rewind or replay) - this is not a measure of individual viewers
- Hours viewed - Total number of hours that the content was viewed
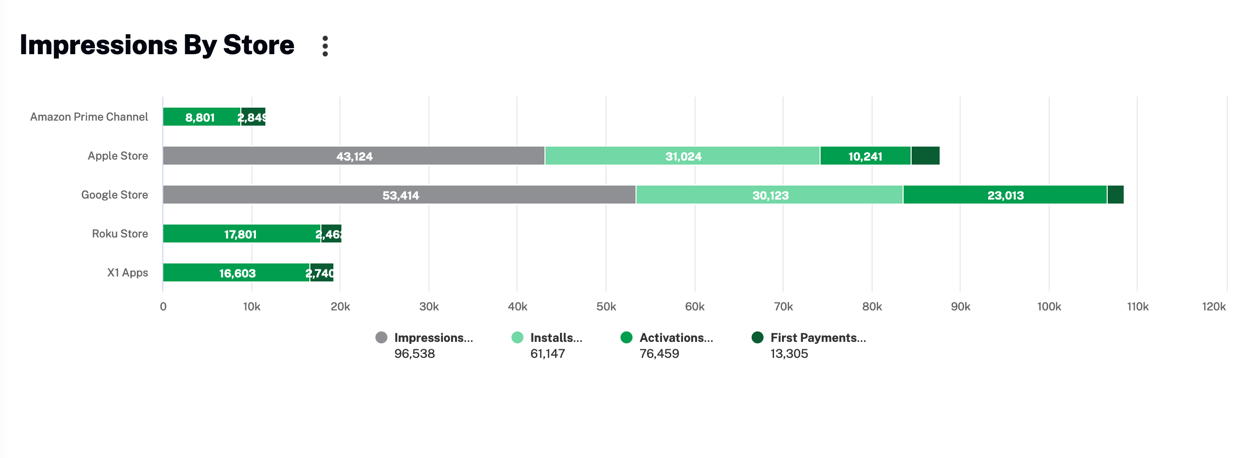
Impressions By Store
View video impressions, installs, activations, and first payments for each app store.
Actions
Here are the available actions:
-
Click
to download subscription data as a CSV file or a PNG image.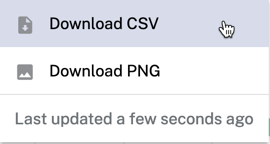
Data
Hover over the graph to display data.
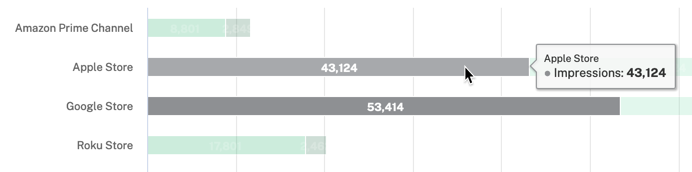
- Impressions - Number of times a video was loaded into a player and ready for interaction
- Installs - Number of times users have installed your app from a store
- Activations - Number of times users have activate your app
- First Payments - Number of first-time subscription payments within the selected timeframe
Impressions By Store
View video impressions, installs, activations, and first payments for each app store.
Actions
Here are the available actions:
-
Click
to download subscription data as a CSV file or a PNG image.
Data
Hover over the graph to display data.
- Impressions - Number of times a video was loaded into a player and ready for interaction
- Installs - Number of times users have installed your app from a store
- Activations - Number of times users have activate your app
- First Payments - Number of first-time subscription payments within the selected timeframe
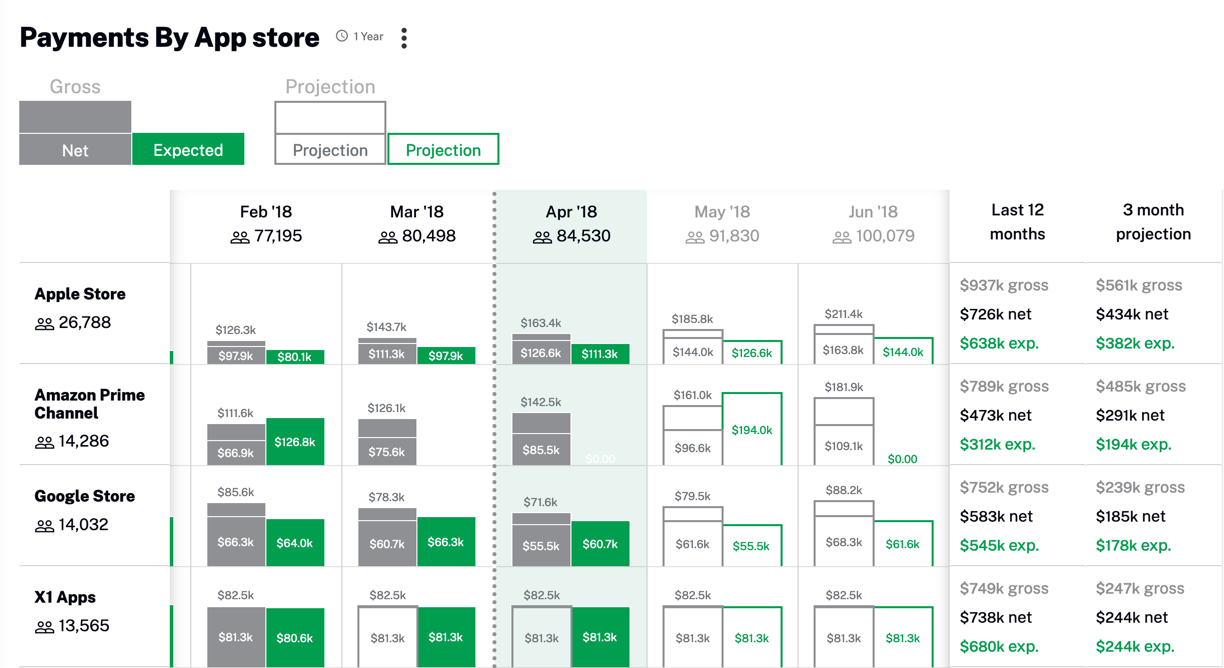
Payments By App Store
See payment data including gross, net, expected and projected amounts for each app store.
Actions
Here are the available actions:
-
Click
to download subscription data as a CSV file.
Data
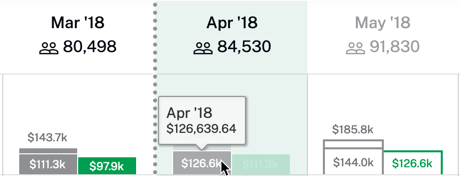
Hover over the chart to display data.
- Gross - Gross revenue earned from subscriptions
- Net - Revenue earned from subscriptions minus the app store's promotion and management fees
- Expected - Expected net revenue earned from subscriptions
- Projection (Gross) - Projected gross revenue
- Projection (Net) - Projected net revenue
- Projection (expected) - Projected expected revenue
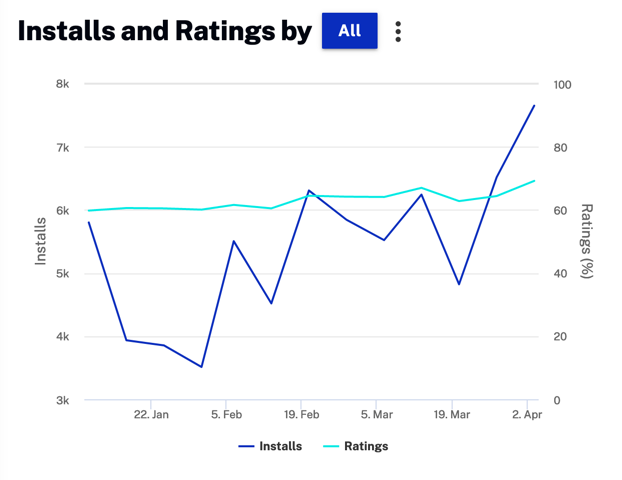
Installs and Rating By Store
See number of installs and user ratings by app store.
Actions
Here are the available actions:
-
Click
to filter by store:- All
- Google Store
Apple Store
-
Click
to download subscription data as a CSV file or a PNG image.
Data
Hover over the graph to display data.
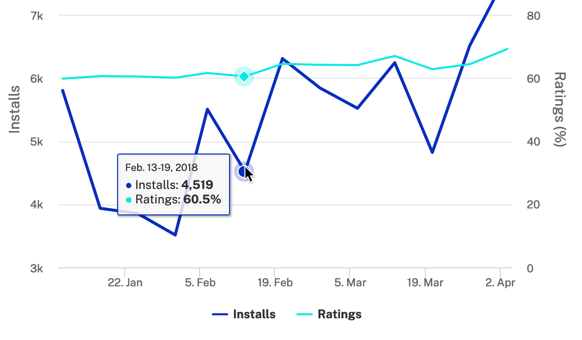
- Installs - Number of app installs for a store
- Ratings - Percentage rating on a scale from 0 to 100
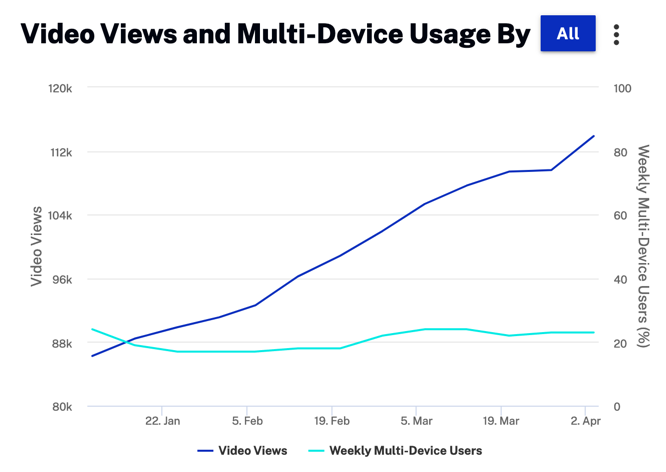
Video Views and Multi-Device Usage By Store
See the number of video views and device usage by app store.
Actions
Here are the available actions:
-
Click
to filter by store:- All
- Google Store
- Apple Store
Amazon Prime Channel
-
Click
to download subscription data as a CSV file or a PNG image.
Data
Hover over the graph to display data.
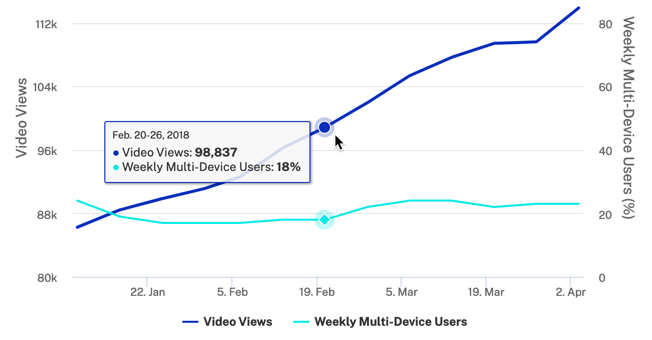
- Video Views - Number of times a video started playing, recorded when the stream is started (does not include rewind or replay) - this is not a measure of individual viewers
- Weekly Multi-Device Users - Percentage of viewers using multiple devices each week