Introduction
Popular content metrics allow you to quickly determine how engaged your audience is with your content. With this information, it is possible to visualize all the content attracting the viewers' attention, making it possible to collect the hours viewed and the views of the videos.
Popular content by
Popular content by metric allows you to see views and hours viewed of the most famous content broken down by title, series, genre, channel, and sport.
Overview
Quickly view a summary of popular content by data.
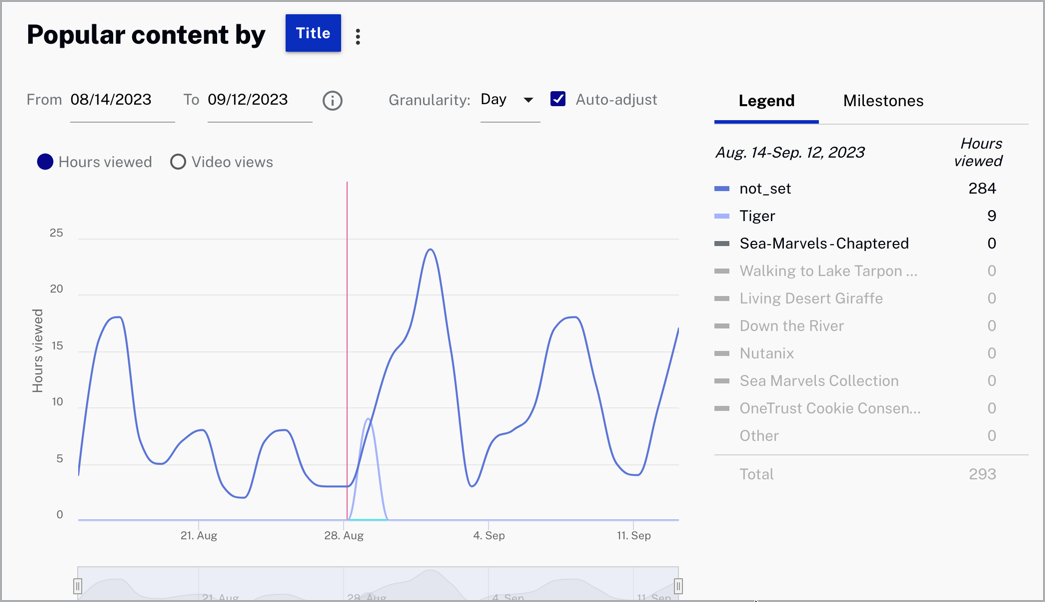
Review popular content data:
- Legend - Representation of entries on the plotted area of the popular content by graph
- Hours viewed - Range of hours viewed per subscriber
Actions
Here are the actions that are available for this graph.
-
Click
 to download data as a CSV
file or a PNG image.
to download data as a CSV
file or a PNG image.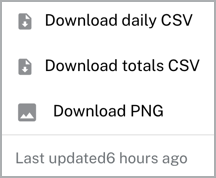
Select a date range for your data.

Select the x-axis granularity to be Day, Week or Month.

- Check
 to automatically change the x-axis dimension
to day.
to automatically change the x-axis dimension
to day.
- Select
 to automatically change the data by hours viewed or video views.
- Hover over the legend section to see the specific data for each content listed.
Milestones
Milestones track progress against your decisions and are persistent throughout each tab of the Scorecard.
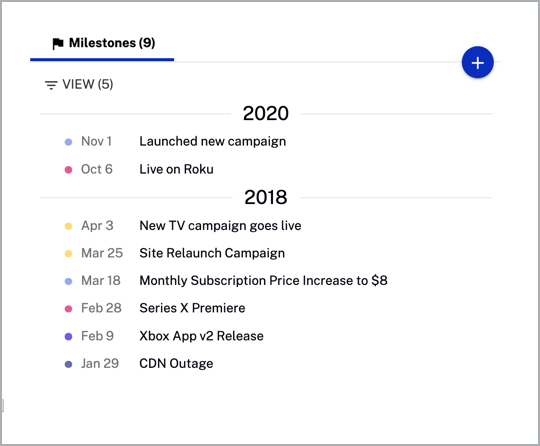
Actions
Here are the actions that are available for the milestones section.
-
Click
 to add a new
milestone.
to add a new
milestone.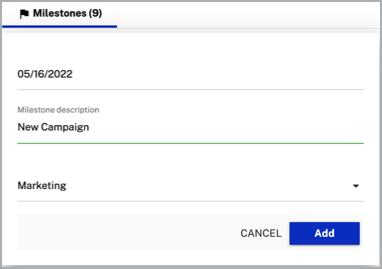
-
Click
 to delete or edit a
milestone.
to delete or edit a
milestone.
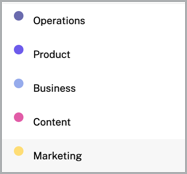
-
Click
 to select which views to show.
Key metrics
The key metrics provide and unified view of your content data.
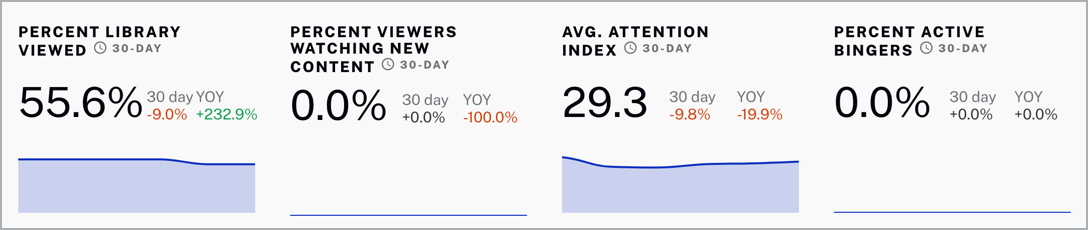
Review key metrics data:
- Percent library viewed - Percentage of videos of your library watched
- Percent viewers watching new content - Percentage of viewers who may or may not be subscribed who are watching the new content
- Avg attention index - Average of the number of dissatisfied viewers, who watch at least 1 minute of the video but do not get to at least
- Percent active bingers - Percentage of users who has watched three or more episodes of the same series in a 24 hour period
Actions
- Click to download data as a CSV
file.

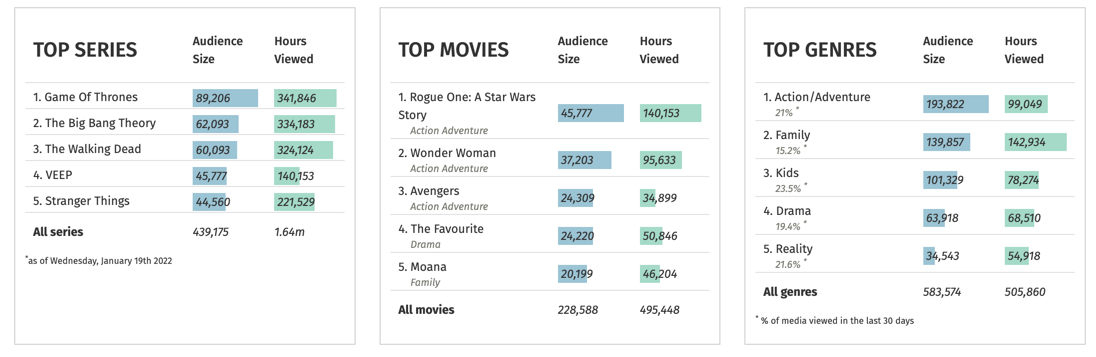
Summary Engagement
Summary engagement shows a summary of the content that generates more engagement among users divided into series, movies, and genres.