Introduction
Engagement status over time metrics allow you to quickly determine the frequency of engagement of the audience with the service provided. With this information, it's possible to create communication strategies aimed at different groups of viewers to ensure that they come back for more.
Engagement status over time
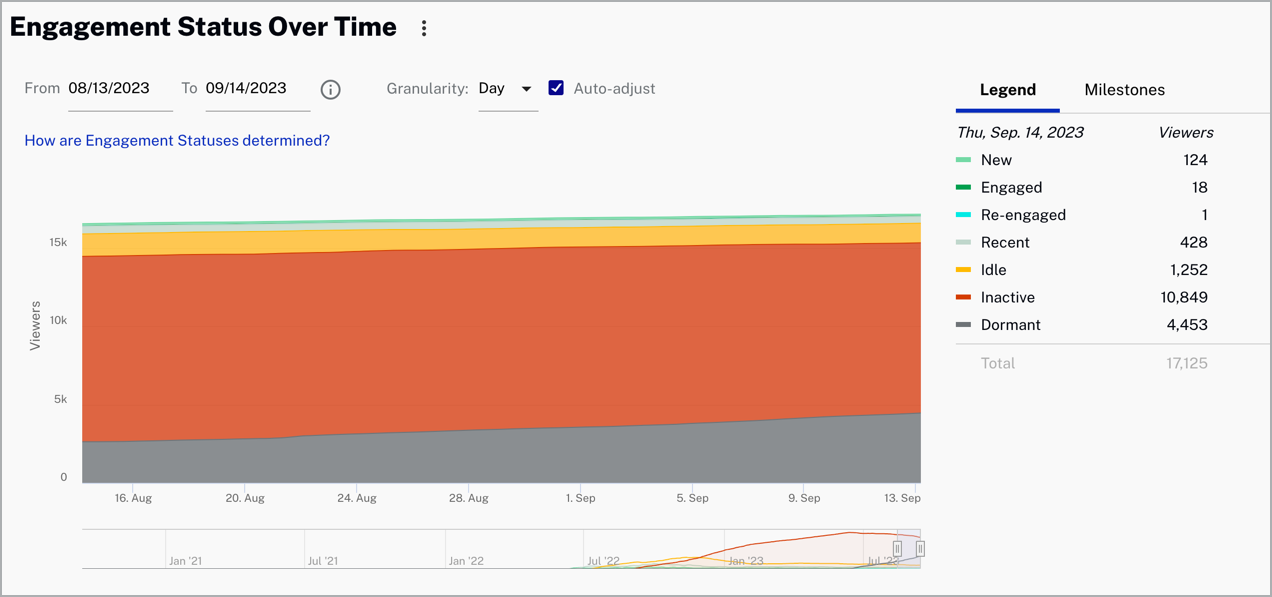
Engagement status over time metrics allow you to see the views, hours viewed, audience size, and sessions over time broken down by Engagement Status.
Overview
Quickly view a summary of engagement status over time data.
Review engagement status over time data:
- Legend - Representation of entries on the plotted area of the engagement status over time graph
- New - Users with a view in the last week but none in the last year
- Engaged - Users with multiple views last month; views may not have gaps longer than 28 days from previous views
- Re-engaged - Users with a view in the last week but no views in the prior four weeks
- Recent - Users with no views in the last week but at least one view in the prior three weeks.
- Idle - Users with no views in the last four weeks but at least one view in the prior eight weeks
- Inactive - Users with no views in the last 12 weeks but at least one view in the last year
- Dormant - Users with no views in the last year
Actions
Here are the actions that are available for this graph.
-
Click
 to download data as a CSV
file or a PNG image.
to download data as a CSV
file or a PNG image.
Select a date range for your data.

Select the x-axis granularity to be Day, Week or Month.

- Check
 to automatically change the x-axis dimension
to day.
to automatically change the x-axis dimension
to day.
- Hover over the legend section to see the specific data by New, Engaged, Re-engaged, Recent, Idle, Inactive, and Dormant.
Examples
-
Disinterested user
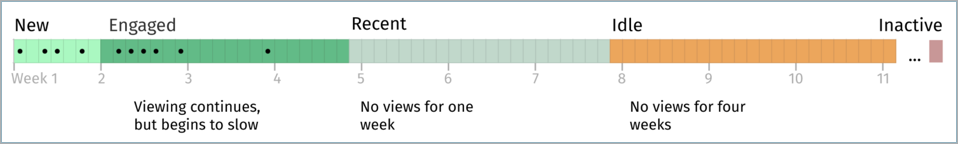
Disinterested User -
Spotty viewing
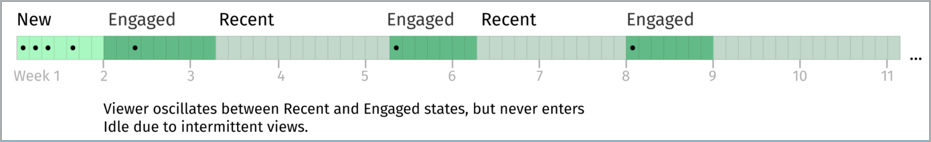
Spotty viewing -
Seasonal viewing
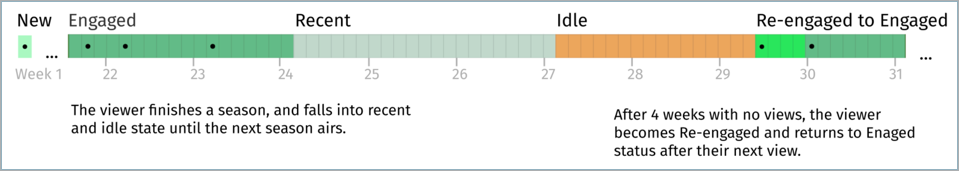
Seasonal Viewing
Milestones
Milestones track progress against your decisions and are persistent throughout each tab of the Scorecard.
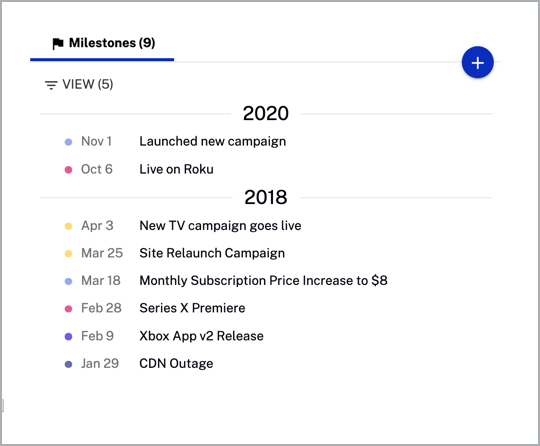
Actions
Here are the actions that are available for the milestones section.
-
Click
 to add a new
milestone.
to add a new
milestone.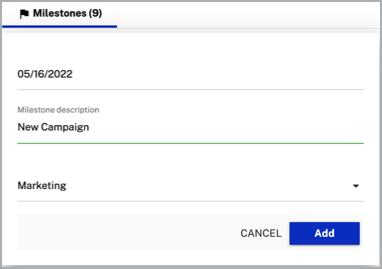
-
Click
 to delete or edit a
milestone.
to delete or edit a
milestone.
-
Click
 to select which views to show.
Key metrics
The key metrics provide a unified view of your video data.
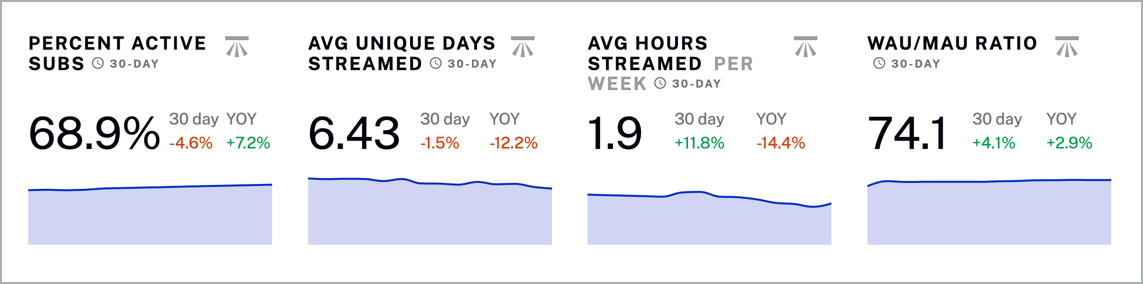
Review key metrics data:
- Percent active subs - Percentage of your paid subscriptions active
- Avg unique days streamed - Average unique days stramed for a user
- Avg hours streamed per week - Average number of hours streamed per week for a user
- WAU/MAU ratio - Weekly Active Users (WAU) as a percentage of Monthly Active Users (MAU); active users are defined as being signed in
Actions
- Click
 to show benchmark data.
- Click to download data as a CSV
file or a PNG image.