Looking Beyond Views to Find Entertainment Value in OTT Content
Relying on video views alone as a measure of OTT content success and audience satisfaction can be a dangerous game for a video service. It is not unusual for content that is heavily promoted to garner views. But that can create a false echo chamber if those viewing sessions are largely abandoned. Last year we introduced a concept called the Attention Index, which is a way of measuring how entertaining content is, by factoring in completion rates, vis-a-vis early abandonment, and assigning a score for every piece of content. Our customers have used this to choose which content to promote, use as heroes, and in licensing negotiations.
We’ve taken this concept a natural, but powerful step forward and are now leveraging the Attention Index in combination with the audience size statistics that we track to provide a sense of relative content performance. We’re excited to introduce two new measurements that we think will prove extremely valuable to our customers.
The first is a
Net Service Rating. We calculate this by first determining the gross rating points (GRP) for a piece of content during the first 30 days of availability. GRPs are calculated by starting with total audience members that watched a specific title, divided by the overall possible audience (all paying subscribers). We then determine a Net Service Rating by taking the gross rating and multiplying it by the Attention Index for that content. The result is a measurement that takes into account the relative audience size and how entertaining the content is. Sorting by Net Service Rating will show you your most valuable content in rank order.
The second new metric we call
Net Service View Share. We calculate this by first determining the gross view share for a piece of content during the first 30 days of availability. Gross share is calculated by starting with total views of a specific title, divided by overall library views. We then determine a Net Service View Share by taking the gross view share and multiplying it by the Attention Index for that content. The result is a measurement that takes into account the relative percentage of overall views and how entertaining the content is. Sorting by Net Service View Share which content contributes the most entertaining views to your service, which is another way of thinking about value.
Delve Deeper into Your OTT Content Catalog
All of the work discussed above is part of a much larger overhaul of our Content page. Not surprisingly, we’re big fans of using data to drive our product development priorities. In reviewing the Insights Scorecard usage analytics, one thing that has become really clear is that our customers are really interested in understanding their content library and how their audience engages with it. As a result, the Insights Scorecard Content page consistently drives high engagement amongst our customers. That alone makes the page worth investing in to drive even more value into it. But that heavy use has also driven a steady stream of feature requests.
Increase Audience Lifetime Value Through Data-driven Insights
Can we explore our entire library instead of just the most popular content?
Can you make the interface searchable?
Is there a way to compare VOD vs Linear/Live consumption?
Can you please add sports metadata?
We took all of these questions to heart, and are really excited to introduce the new
Content Catalog Insight. This Insight packs a ton of functionality into one powerful table and addresses every request outlined above.
Explore Your Entire Catalog
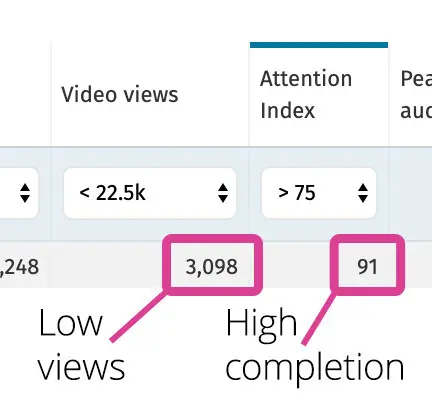
hidden gems
Fig. 1 – Find hidden gems by filtering content with low views and high completion (Attention Index).
We now load in data for every title in your catalog, allowing you more options for exploring the overall effectiveness of your catalog. Given that you can now sort and filter in lots of new ways, having your entire library at your fingertips makes uncovering new insights easy and actionable.
One really powerful use case for this is to find content that has a high completion rate but low viewership. Essentially we make it easy to surface hidden gems (Fig. 1) that are worth promoting to a larger audience.
It’s also really easy to look at only movies, or episodes, compare series to one another and see the relative performance and entertainment value of different genres.
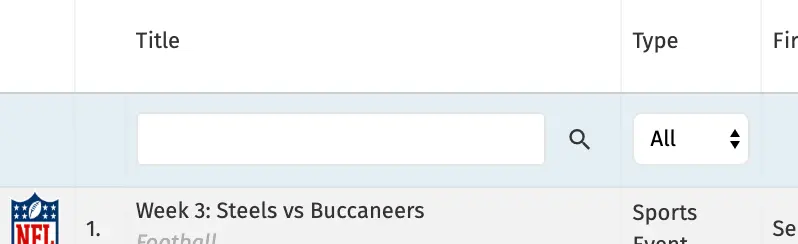
Find Any Title Easily
Fig 2. – Find any content easily with search.
By adding search (Fig. 2) to this Insight, we’re addressing a common use case, where our customers want to see metrics for a particular series or movie. Instead of paging through results, you can now get the right to the content you are looking for immediately. Many of our customers asked for this because they wanted to be able to easily find any title when in content licensing discussions, reviewing promotions, etc.
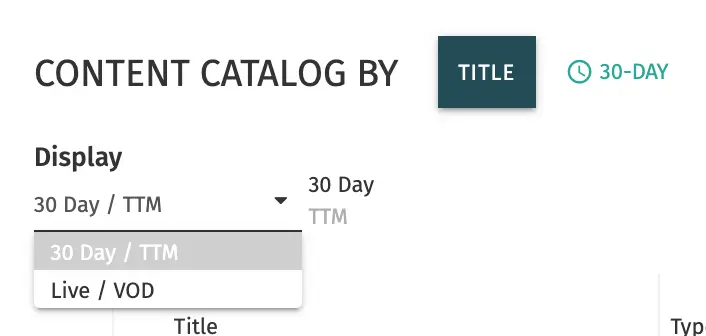
Seeing the Impact of Live/Linear
Fig. 3 – Compare live Linear vs VOD viewing.
For customers that offer linear channels and/or live events, it is now easy to see that consumption in contrast to on-demand (Fig. 3). We focus this comparison on the last 30 days since linear viewing is most interesting in a relatively short time period. While the use case for content like sports is obvious here, it is also interesting to understand consumption patterns of theatrical and episodic content. In the latter case this could definitely inform the most effective windowing strategies for seasons of content (e.g. linear premiere followed by weekly drops, vs full season drop simultaneous with linear premiere, etc).
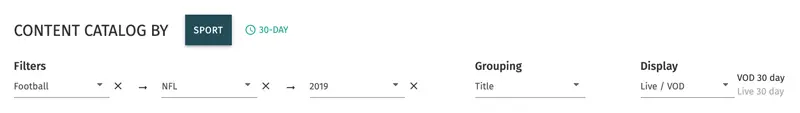
Sports Gets First-Class Treatment
In addition to adding significant new functionality, we have also added support for sports content in our metadata taxonomy (Fig. 4). Content can now be organized by sport, league, season or event, and sorted by audience size, views, etc. These tags will dynamically appear in the Scorecard accounts where properly tagged sports content is present. This support, coupled with support for live viewing engagement makes the Insights Scorecard a powerful tool for pure sports services as well as services that provide a mix of sports and entertainment.
Fig. 4 – The Content tab now supports the metadata taxonomy of sports content.
Used in conjunction, the functionality outlined above provides unprecedented insight into content performance and how every episode, movie, series, sports event, season, league, sport, and genre in your library stack up.