Introduction
Content Catalog and Content Explorer metrics can compare specific titles to see how they performed against each other. They can look at seasonal trends across multiple series to identify cross-promotional opportunities. With this information, it is possible to create engagement strategies to increase views and attract more subscribers.
Content catalog by title
The content catalog metric packs a ton of functionality into one powerful table to provide a sense of relative OTT content performance broken down by title, series, genre, channel, and sport.
Overview
Quickly view a summary of content catalog data.
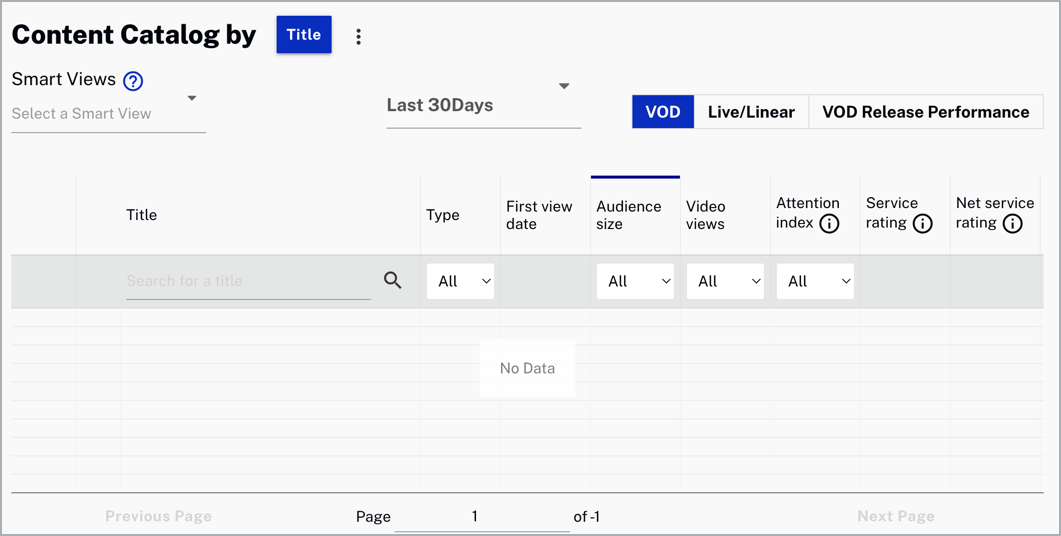
Review content catalog data:
- Title - Title of the content viewed
- Type - Type of content viewed
- First view date - Date of the first view
- Audience size - Number of unique viewers
- Video views - Number of times a video started playing
- Attention index - On a scale of -100 to 100 compares the number of dissatisfied viewers with the number who watch to at least 75% completion
- Service rating - Percentage of your total audience that watched this content
- Net service rating - Percentage of your total audience that have watched this content with an Attention Index greater that 75
- Service view share - Percentage video views relative to total service views
- Net service view share - Percentage video views relative to total service views. Only content with an Attention Index of 75 or greater are counted
Actions
Here are the actions that are available for this table.
-
Click
 to download data as a CSV
file.
to download data as a CSV
file.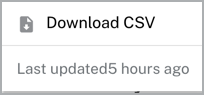
-
Click
 to select a Smart View.
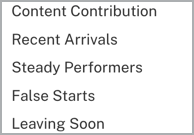
-
Click
 to select a date to retrieve data.
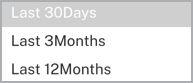
-
Select
 to automatically change the table data and filter by VOD, Live/Linear, VOD Release Performance.
 -
If you select the VOD Release Performance you can click
 to see a graphic with the view trends.
Content explorer by
The content export metric provides you with big pictures, as well as incredibly detailed views of your content consumption. You can filter the data by movies, series, or all.
Overview
Quickly view a summary of content export data.
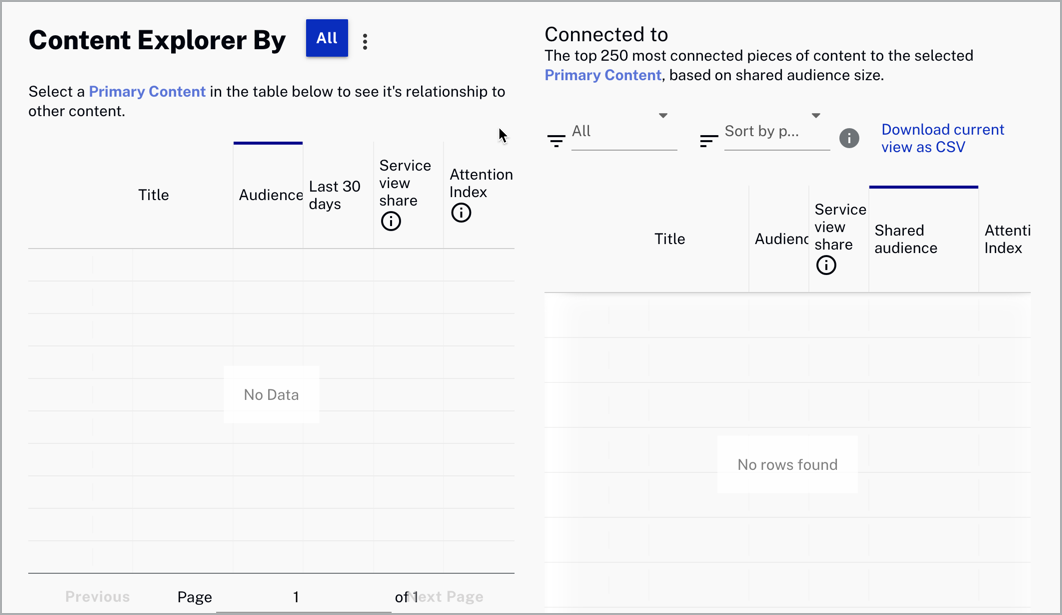
Review content export data:
- Title - Title of the content viewed
- Audience - The count of audience members who viewed this content during the time range
- Las 30 days - The count of audience members who viewed this content over the last 30 days
- Service view share - Percentage of video views relative to total service views
- Attention index - On a scale of -100 to 100 compares the number of dissatisfied viewers with the number who watch to at least 75% completion
- Shared audience - Shared audience between the primary and connected content
Actions
Here are the actions that are available for this table.
-
Click
to download data as a CSV
file.
-
Click
 to automatically change the table results and filter by Series, Movies or All.
-
Click
 to filter by Series, Movies or Primary genre.
-
Click
 to sort by presets.
-
Click
 to download the current view as a CSV file.