Introduction
Linear Insights provides viewing metrics for Brightcove live channels. This includes hours viewed over time and a list of your top live channels by audience size and hours viewed. To help with your content planning and promotion, Insights give you a way to identify the days and times with the most consumption. The EPG view allows you to view live metrics by title, series, season, and genre.
Live channel
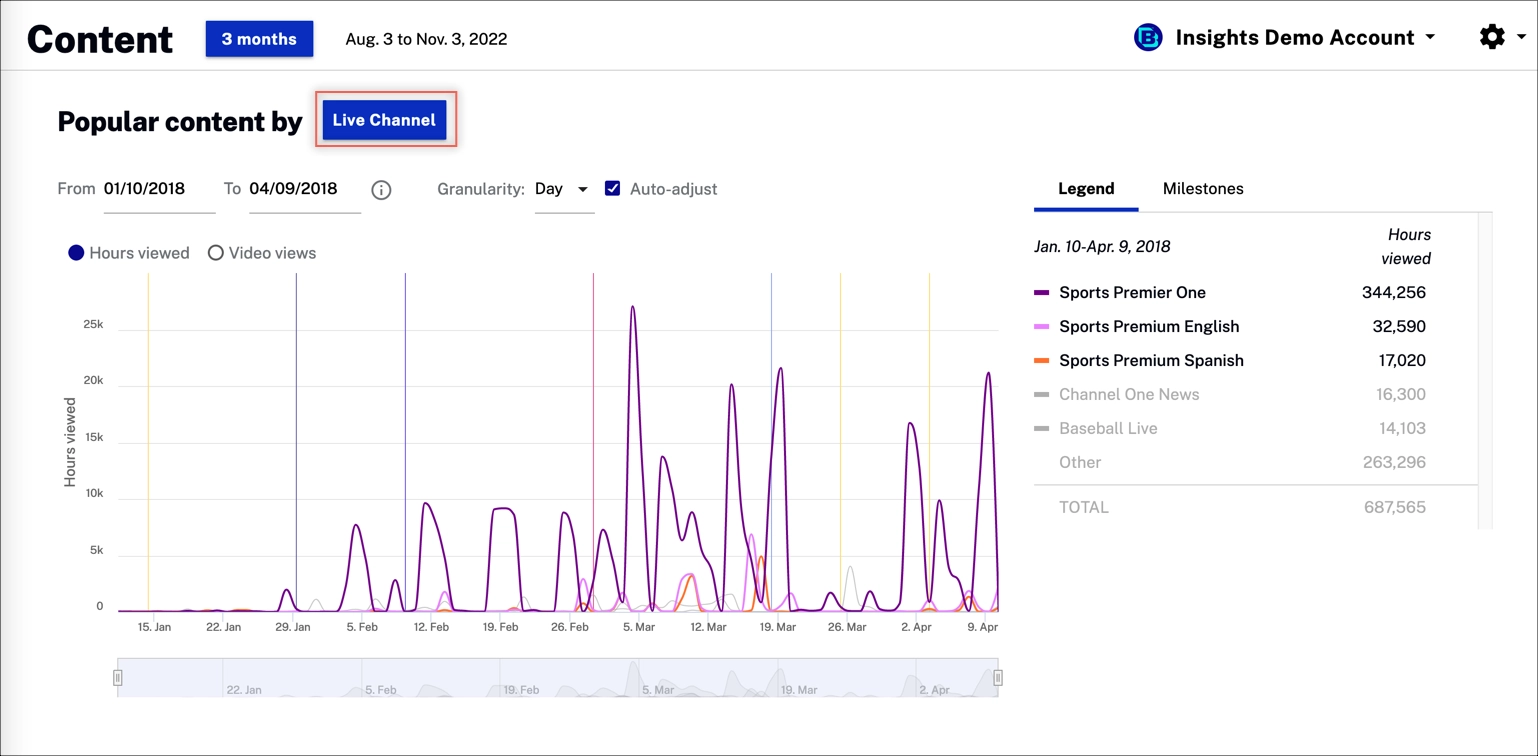
To the Popular content by chart, Brightcove has added a new Live Channel dimension.
The graph below shows Hours viewed/Video views for each channel over time. The graph displays the top channels (10) ranked by hours viewed based on the time range selected.
You can map to milestones to see how an event/premiere impacts the views.
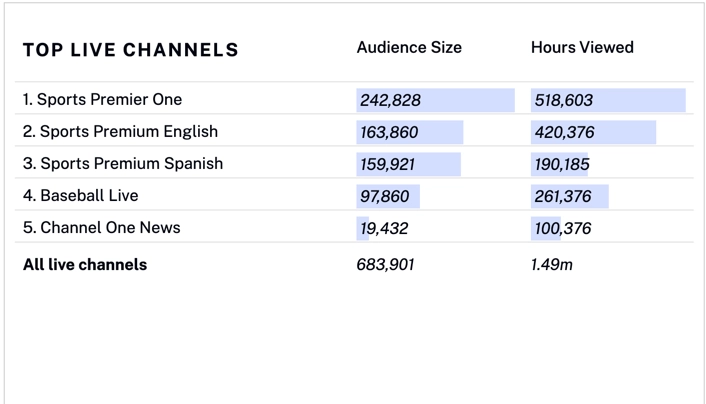
Top live channels
Brightcove has added a new Insight which shows the top 5 channels ranked by Audience Size, which also displays Hours Viewed.
The graph below shows the audience size & hours viewed for top linear channels, based on the date range selected.
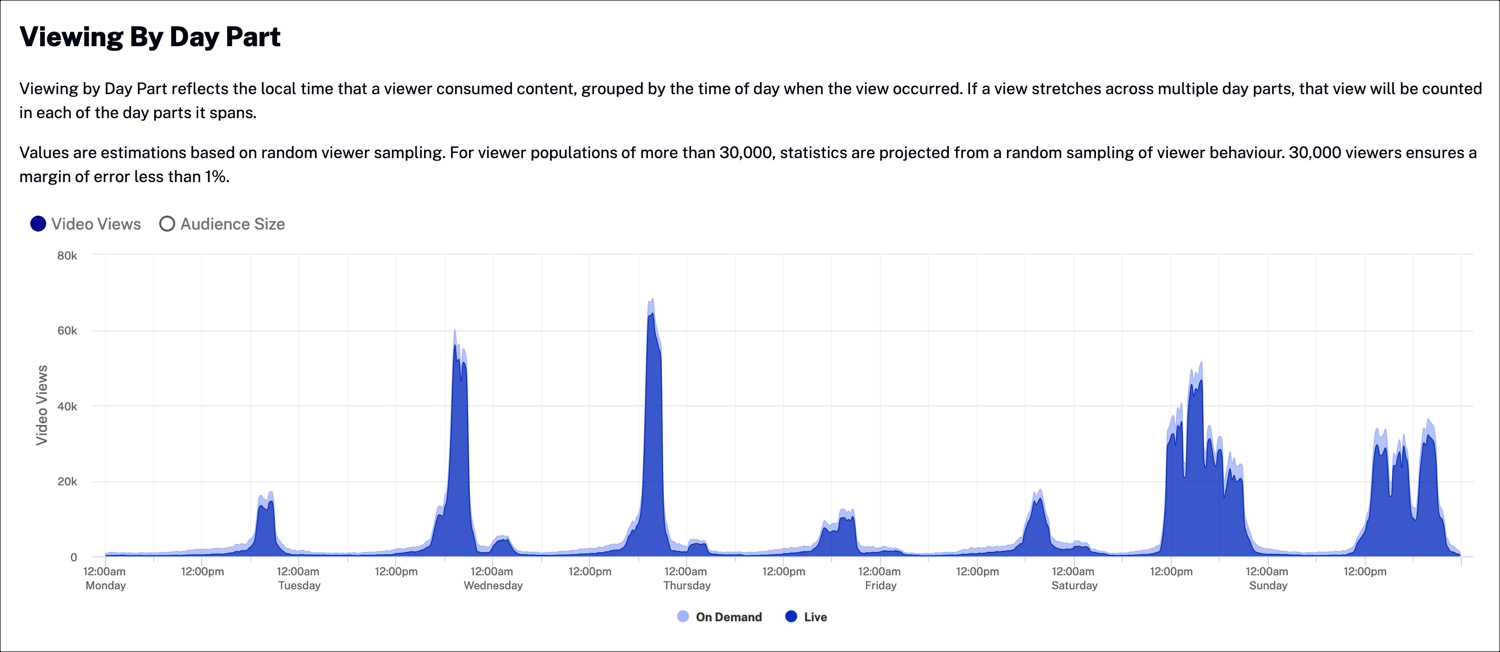
Viewing by day part
Brightcove has added a new Insight which shows popular viewing times in terms of day of week and time of day. This includes both linear/live and VOD viewing.
The graph below shows the days/times with the most consumption and use. This is helpful for your content planning, promotion etc.
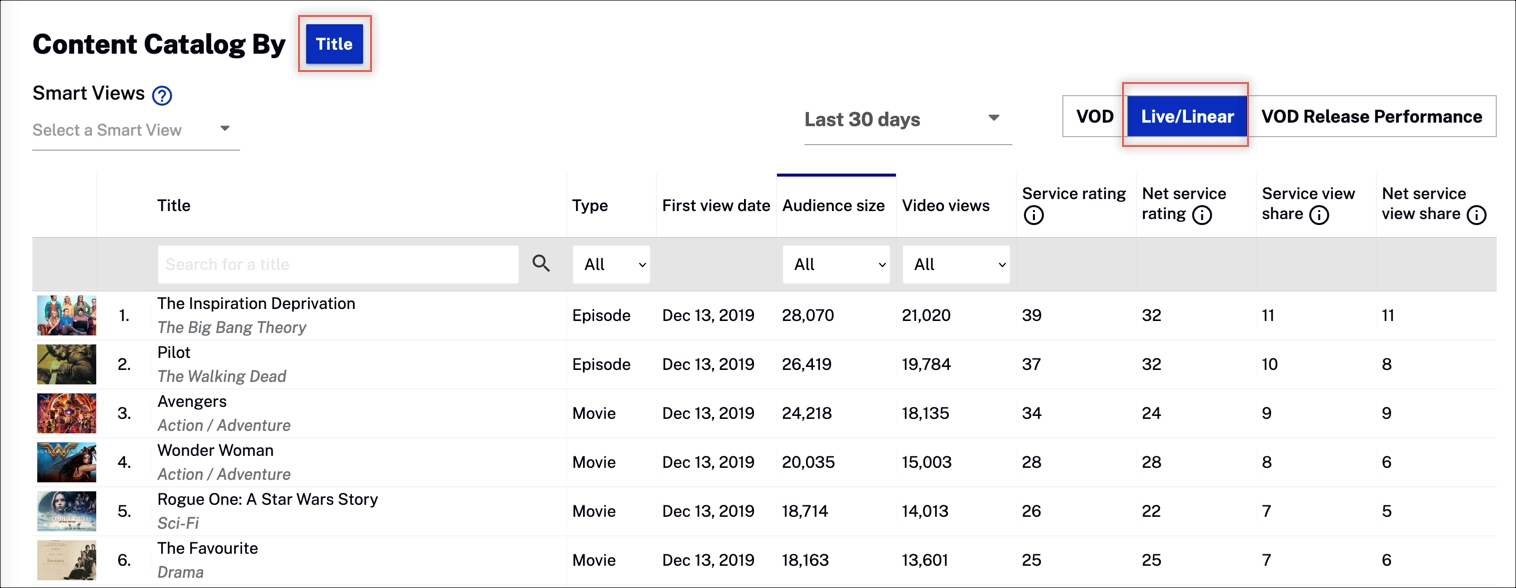
Map to EPG
With live/linear content, Brightcove can map to your EPG data. This allows you to see linear consumption broken out in the same way as VOD, which is by title, season, series, genre levels.
The graph below shows linear consumption at a title level, which you can compare to VOD.