Introduction
Audience insight data integrates your OTT (Over-the-Top) video data sources with subscription video insights to provide actionable insights based on key industry benchmarks.
From your audience insight scorecard, select the Customers tab to see data for your current customers.
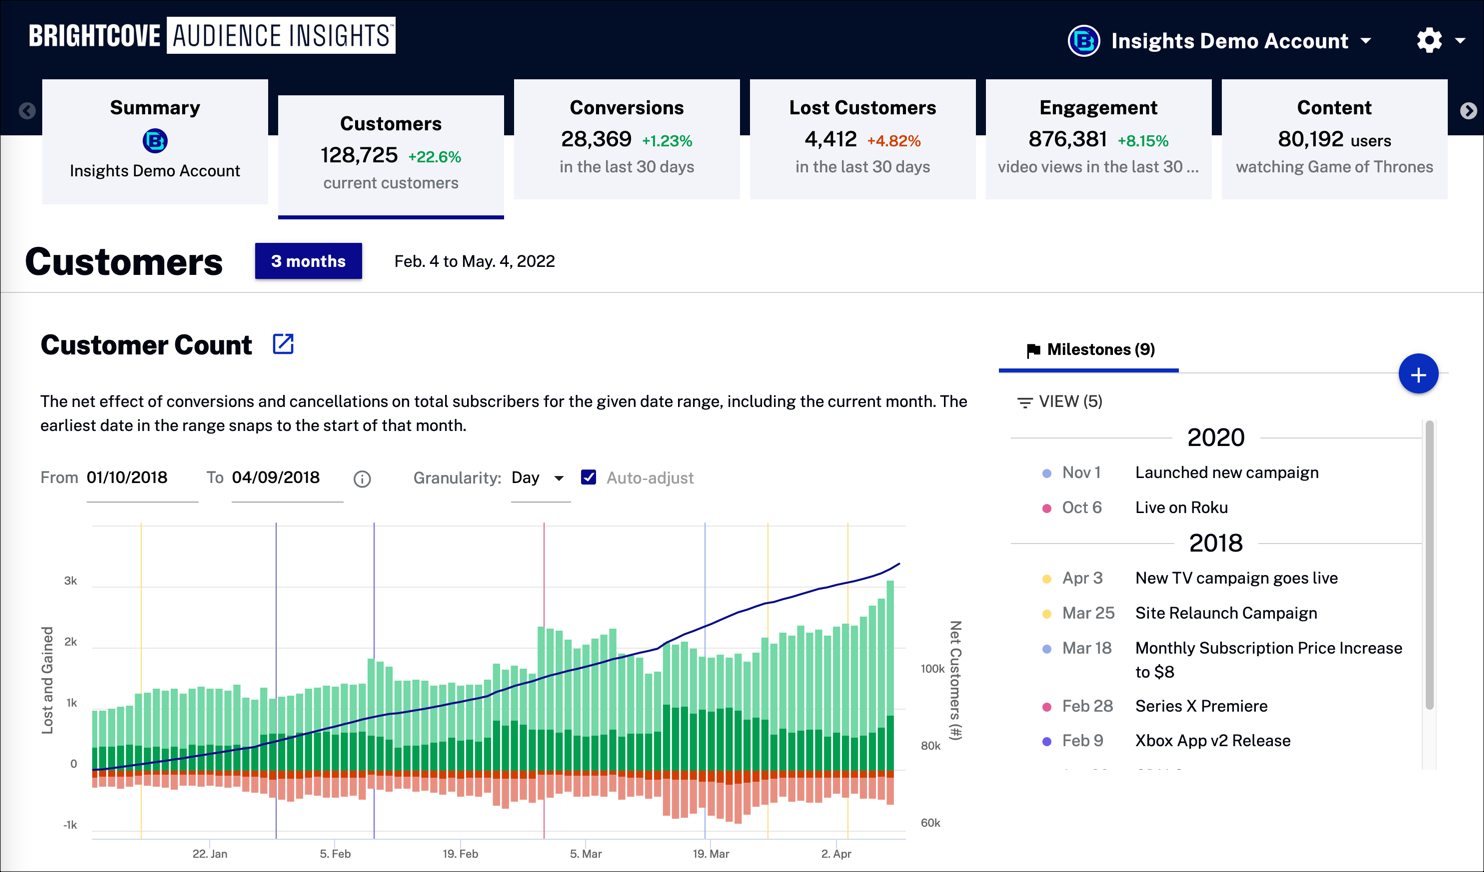
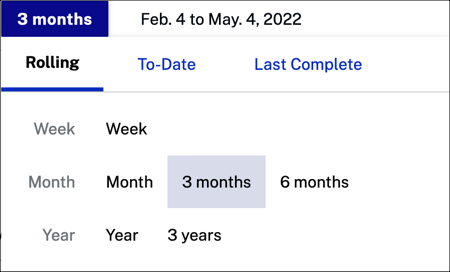
Expand the time span selector and choose a reporting period for your data.
Customer Count
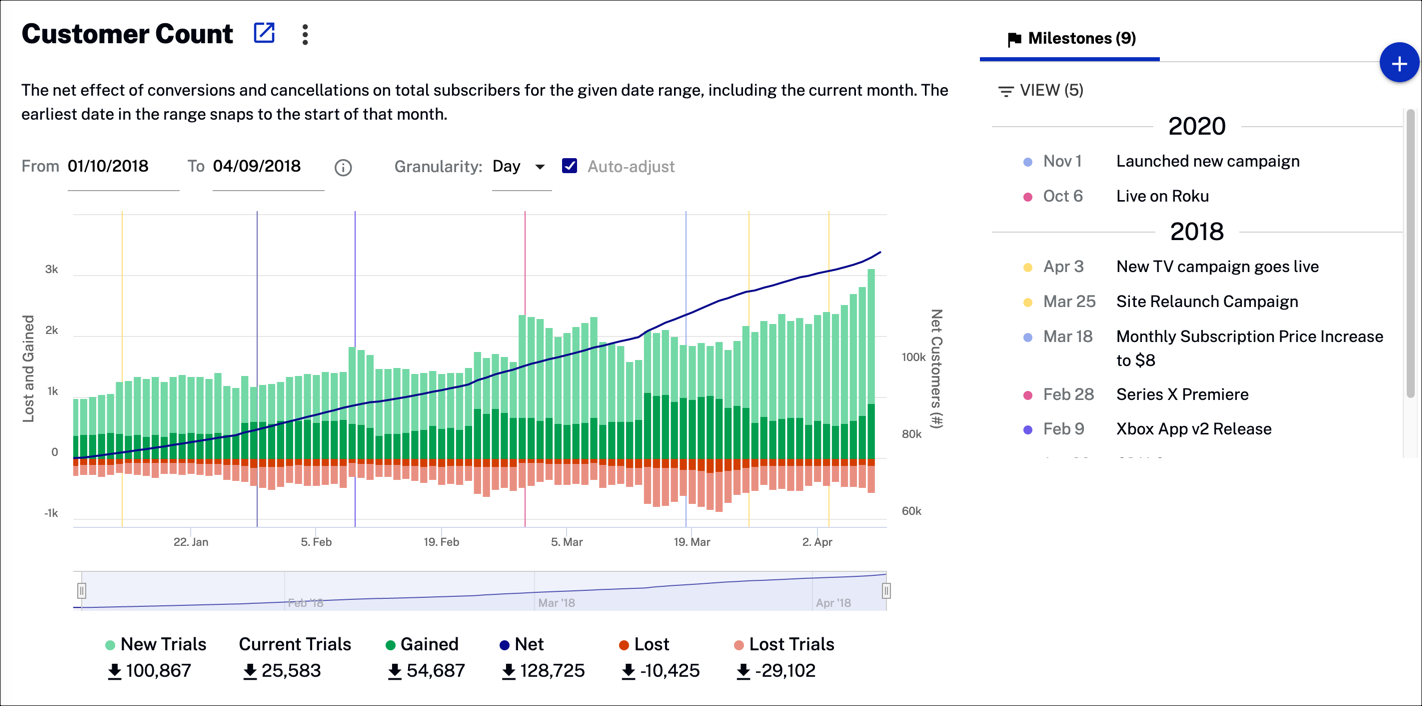
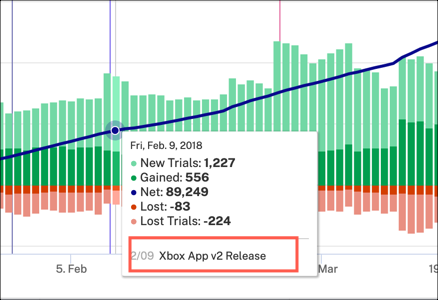
Track your customer count over time. This graph shows the net effect of conversions and cancellations on total subscribers for the current time frame.
Actions
You can select any of the following actions to change the data presented:
- Click
 to download customer change data as a CSV file or a PNG image.

- Click
 to filter customer data by:
- All Customers
- Plan
- Channel
- Device
Country
- Select a date range for your data. Note that the date range should be 5 days or longer.

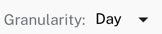
- Select the x-axis granularity to be Day, Week or Month.
- Check
 to automatically change the x-axis dimension.
Data
The following data is displayed in the graph:
- Current Trials - Number of customers on subscription trials
- New Trials - Number of new trial subscriptions
- Gained - Number of new customers
- Net - Number of new customers gained minus number of customers lost
- Lost - Number of customers who have canceled either a trial subscription or a paid subscription
- Lost Trials - Number of subscription trials that were canceled
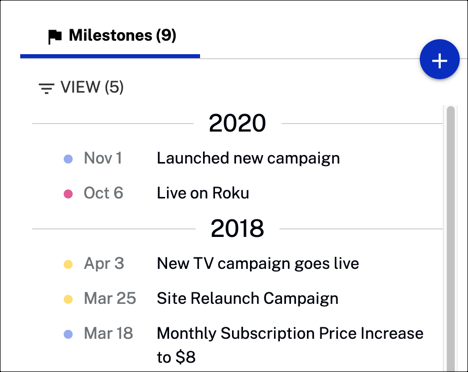
Milestones
Create a milestone to track how it effects your customer count.
Actions
You can select any of the following actions:
- Click View to filter data by:
- Operations
- Product
- Business
- Content
- Marketing
-
>Click
 to create a new milestone. Fill in the form fields and select ADD when complete.
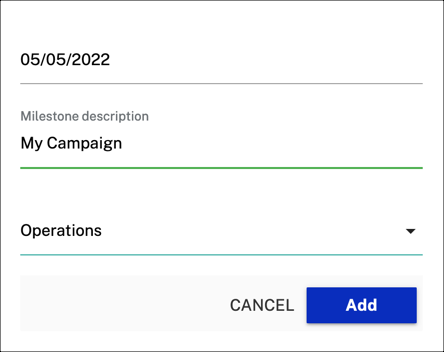
-
Hover over the graph to see data details along with the corresponding milestone.
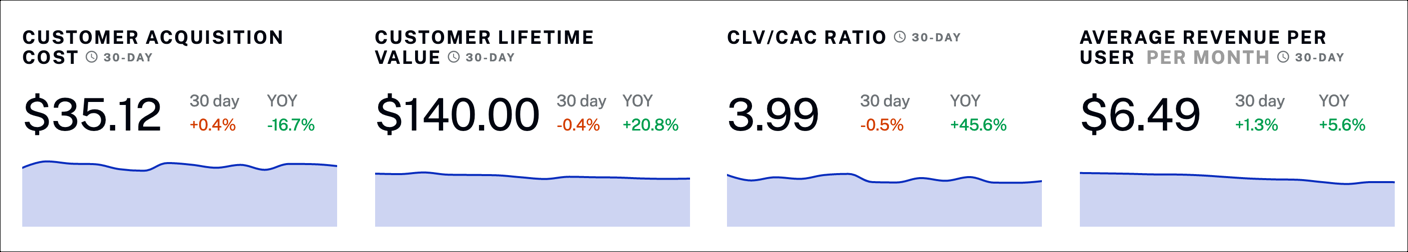
Customer Value
Track your customer count over time. This graph shows the net effect of conversions and cancellations on total subscribers for the last 30 days.
Actions
You can select any of the following actions to change the data presented:
- Click next to each graph to download the associated data as a CSV file.
- Hover over any of the graphs to see data associated with a weekly time range.
Data
The following data is displayed in the graph:
- Current Trials - Number of customers on subscription trials
- New Trials - Number of new trial subscriptions
- Gained - Number of new customers
- Net - Number of new customers gained minus number of customers lost
- Lost - Number of customers who have canceled either a trial subscription or a paid subscription
- Lost Trials - Number of subscription trials that were canceled
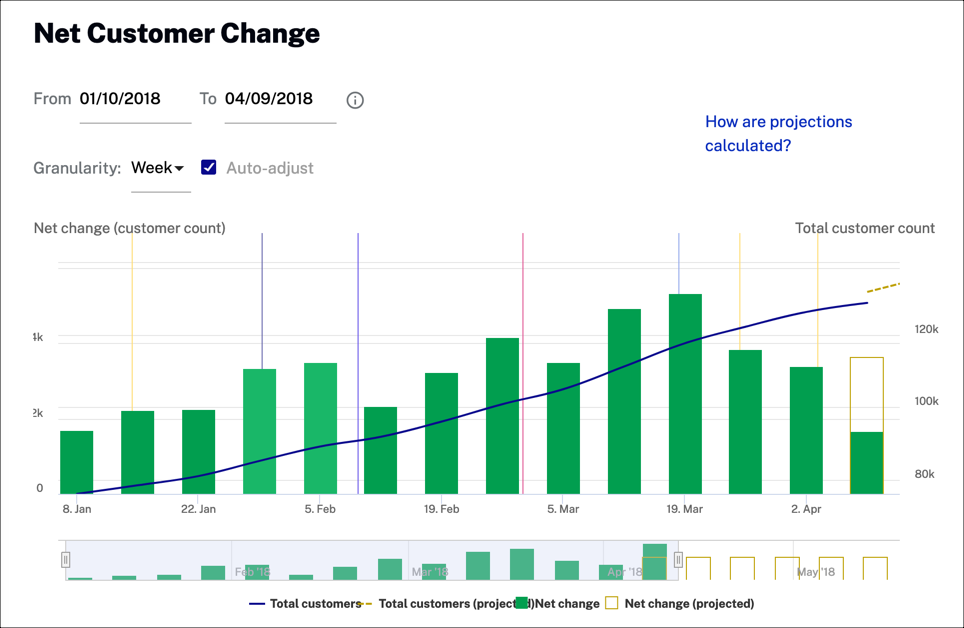
Net Customer Change
See how your customer count changes over time. This graph includes projections and trends and milestones.
Actions
You can select any of the following actions to change the data presented:
- Click to download customer change data as a CSV file or a PNG image.
- Select a date range for your data. Note that the date range should be 5 days or longer.
- Select the x-axis granularity to be Day, Week or Month.
- Check to automatically change the x-axis dimension.
Data
The following data is displayed in the graph:
- Total Customers - Total number of customers
- Total Customers (projected) - Total projected number of customers
- Net Change - Number of customers gained minus number of customers lost
- Net Change - Number of projected net customers
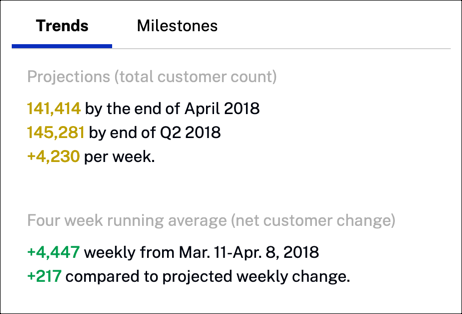
Trends
See the four week running average number of customers as well as the future trends for customer count.
Data
The following data is displayed above:
- Projections (total customer count) - Total projected number of customers for the future
- Four week running average (net customer change) - Net customer change in customer count
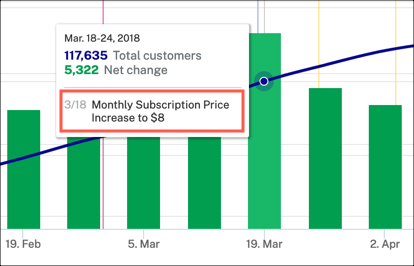
Milestones
Create a milestone to track how it effects your customer count.
Actions
You can select any of the following actions:
- Click View to filter data by:
- Operations
- Product
- Business
- Content
- Marketing
-
>Click
to create a new milestone. Fill in the form fields and select ADD when complete.
-
Hover over the graph to see the data and associated milestone.
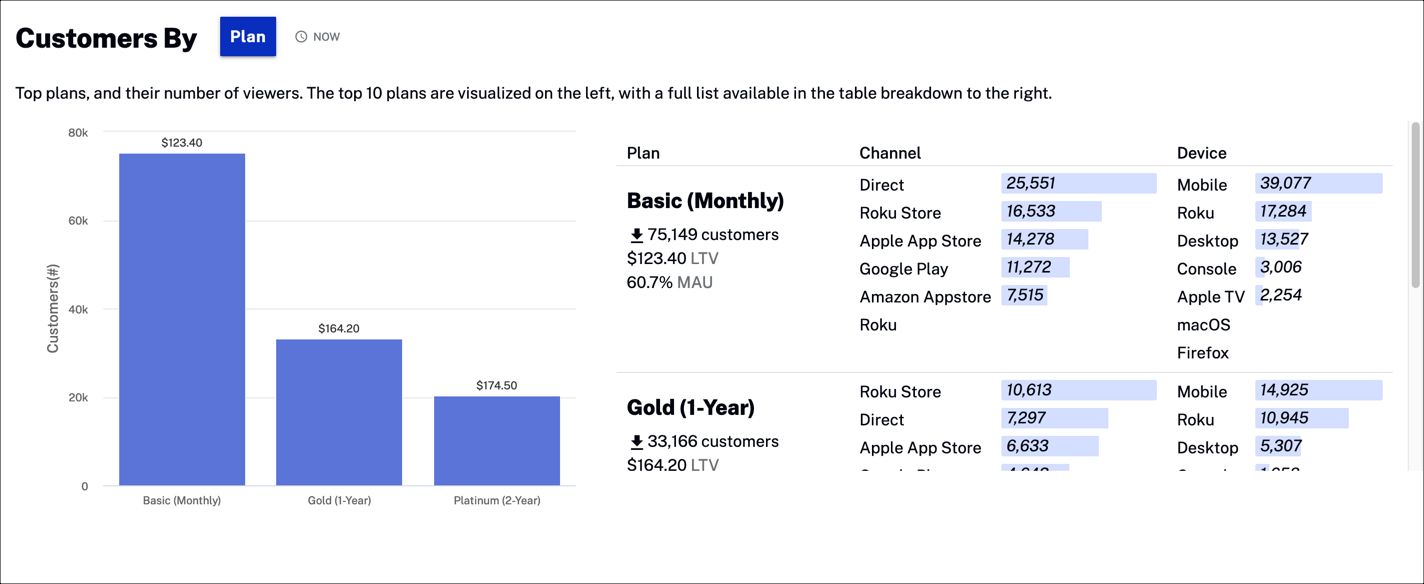
Customers By Category
Display the top number of viewers by category. The top 10 are displayed in the graph, with a detailed list to the right of the graph.
Actions
You can select any of the following actions to change the data presented:
-
Click
 to select the category for the data displayed.
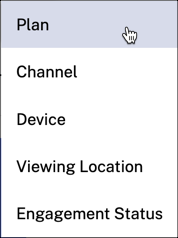
- Hover over
 to see the following note:
- This insight is a current snapshot of your business.
Data
The following data is displayed in the graph:
- Customers(#) - The y-axis show the number of customers for each category; each bar in the graph also shows the revenue from those customers
- Basic (Monthly) - The x-axis shows the types of data for the category chosen; in this case, it is by plan
- Plan - The subscription plan with the rise or drop in number of customers
- LTV - Lifetime value (LTV) estimates the amount of revenue a customer represents to a business over the life of the relationship; this is helpful for determining the cost efficiency of acquiring new customers and supporting them over time
- MAU - Monthly Active Users (MAU); active users are defined as being signed in
- Channel - The app store from where users viewed your channel
- Device - The device from which users viewed your content
Customer Status By Category
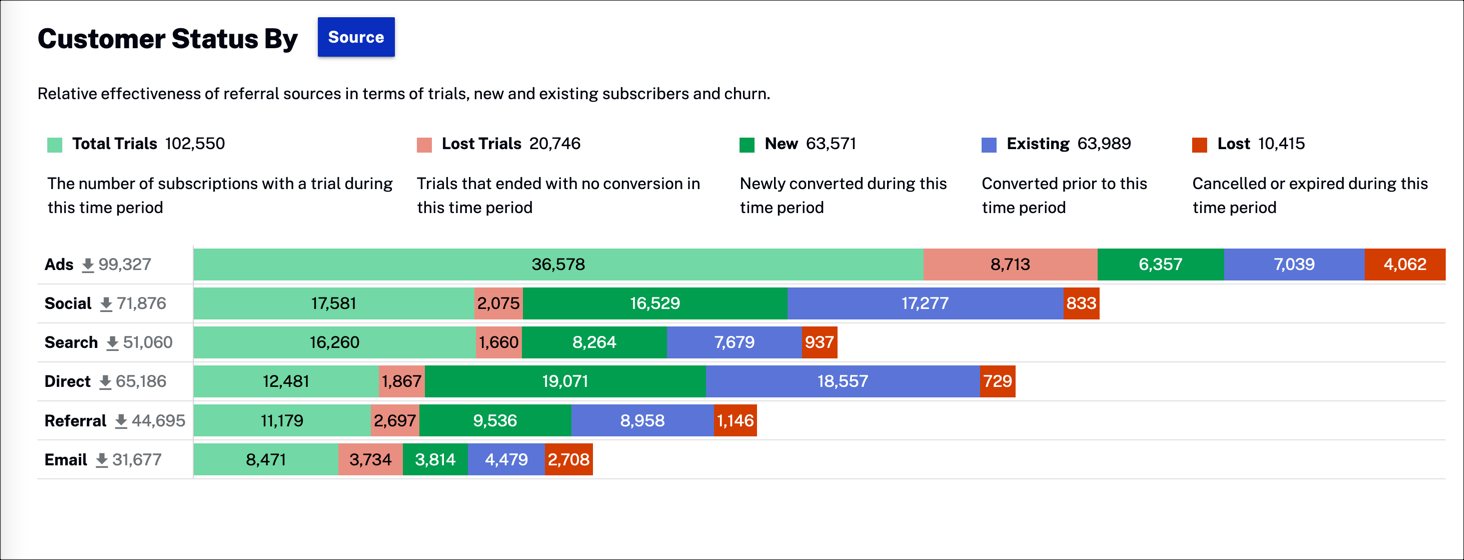
View the number of customers by status relative to referral sources. Status includes trials, new and existing subscribers and churn.
Actions
You can select any of the following actions to change the data presented:
-
Click
 to select the category for the data displayed.
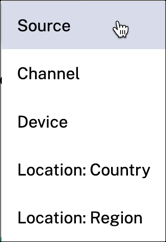
Data
The following data is displayed in the chart:
- Total Trials - Number of subscriptions with a trial during the selected timeframe
- Lost Trials - Trials that have ended with no conversion within the selected timeframe
- New - Number of trials that have converted to paid subscription within the selected timeframe
- Existing - Number of paid subscribers for the selected timeframe
- Lost - Number of subscribers who canceled or let their subscription expire during the selected timeframe
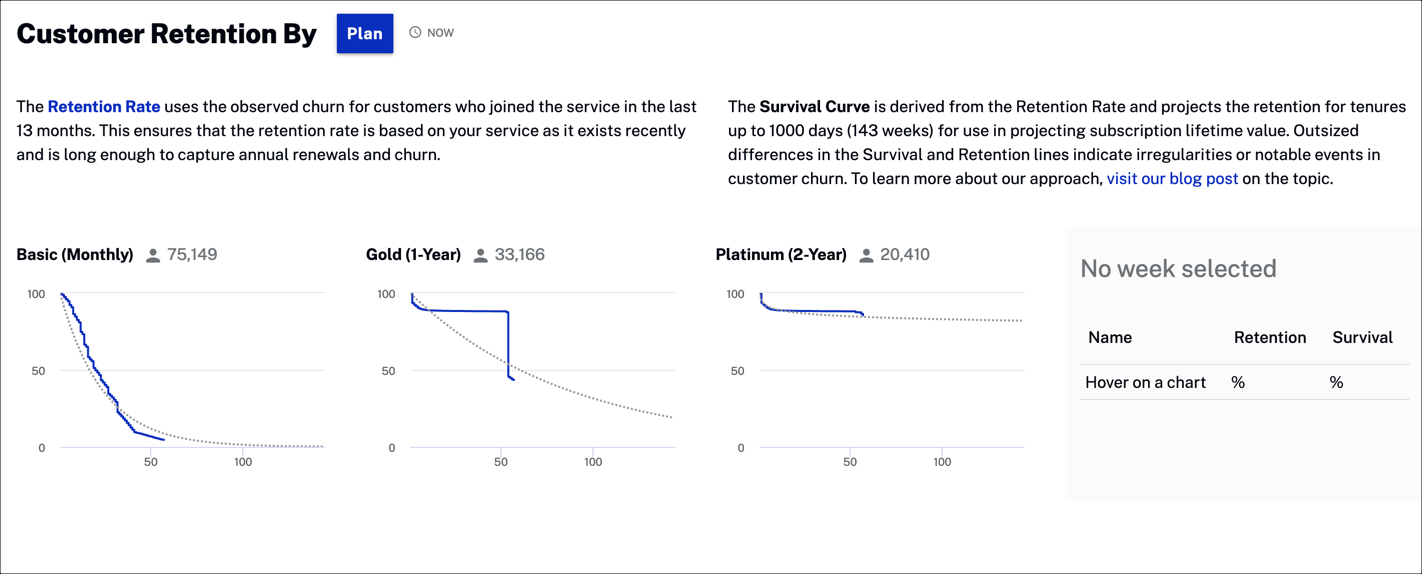
Customer Retention By Category
View customer retention rate and projected survival rate over time.
Actions
You can select any of the following actions to change the data presented:
-
Click
to select the category for the data displayed.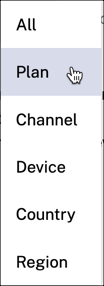
- Hover over to see the following note:
- This insight is a current snapshot of your business.
Data
Hover over any graph to display retention and survival rates in the chart to the right.
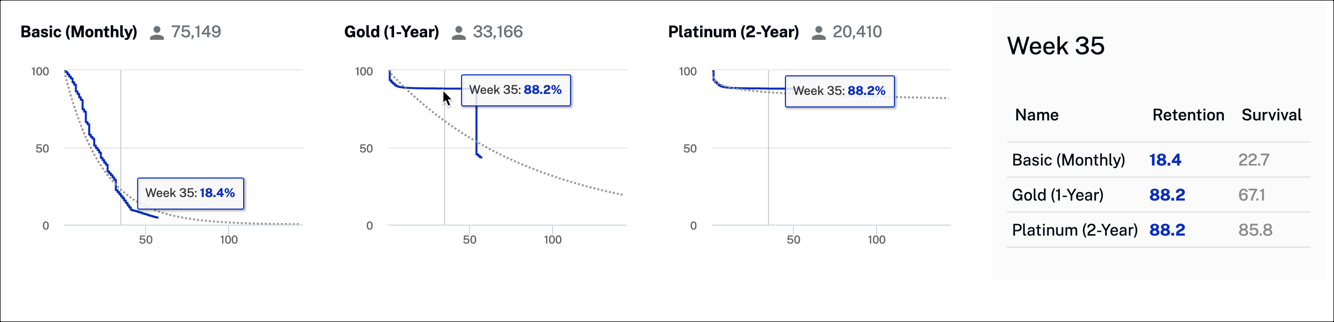
- Retention - Retention Rate uses observed churn for customers who joined the service in the last 13 months; this ensures that the retention rate is based on your service as it exists recently and is long enough to capture annual renewals and churn
- Survival - Survival Curve is derived from the Retention Rate and projects the retention for tenures up to 1000 days (143 weeks) for use in projecting subscription lifetime value; outsized differences in the Survival and Retention lines indicate irregularities or notable events in customer churn
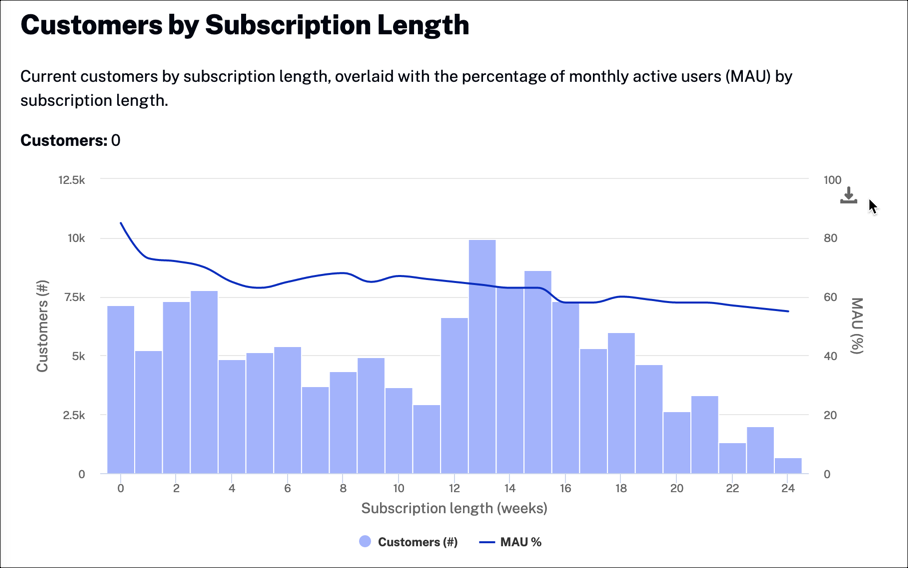
Customers By Subscription Length
View the number of customers by subscription length, and the ratio of monthly active users by subscription length.
Actions
The following actions are available:
- Click
 to download this chart as a PNG image or PDF.
Data
Hover over the graph to display data.
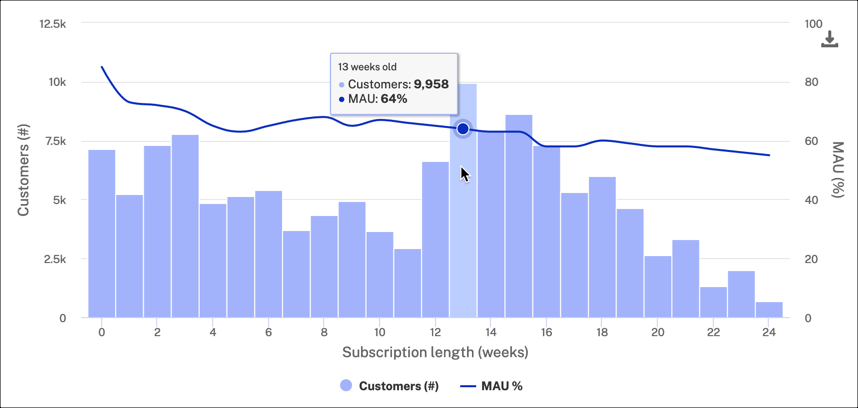
- Customers - Number of customers by subscription length in weeks
- MAU - Ratio of Monthly Active Users (MAU) by subscription length in weeks