Invest with Confidence in Your SVoD Business
How much revenue do you think you will receive from your next customer? How long will they stay in the service and what discounts matter to ensure a long-term customer relationship? Is that exclusive content license only driving short-term subscribers or is it a gateway to a new happy customer?
Each of these questions relies on understanding the lifetime value (LTV) of a customer and using that value to compare natural segments of your users to find veins of satisfied (and long-subscribing) customers. I’m going to cover each of these questions across three blog posts, diving into the methods to calculate the LTV and some of the pitfalls we watch out for in the Insights Scorecard.
Let’s start with what seems like a simple question: “How much do you think you’ll be paid by your next customer?” Will they stay for a few months, then quit? Or, will they join the ranks of your multi-year subscribers? It’s obvious how important this question is — how else would you know whether spending $30 or $60 to acquire a new customer is worthwhile? Understanding the LTV for a specific new customer is very hard, but understanding the LTV of a group of new users shouldn’t be too difficult, right?
Calculating Subscriber LTV
Let’s take the example of PolarFlix, a site for Arctic enthusiasts. They charge $10 per month and have a fairly high monthly churn rate of 20%.
One of the most common ways to measure the lifetime value of a customer is using the churn rate and your average revenue per user (ARPU). We can simply combine those two values to a group of users and, on average, it should reflect the LTV of our average new customer. The formula looks like ARPU/Monthly Churn . For PolarFlix, this is 10/.2 = $50
Let’s play this out a bit. If you imagine that PolarFlix adds 100 customers on December 1st, we would expect this cohort to accrue payments to PolarFlix each month. Here’s a table showing how this “Monthly Churn Model” behaves. ( Note, the actual formula is totally okay with partial customers, because statistics, but I rounded these examples. )
| Date | Current | Lost | Revenue | LTV |
|---|---|---|---|---|
| 12/1/2018 | 100 | $1,000 | $10.00 | |
| 1/1/2019 | 80 | 20 | $1,800 | $18.00 |
| 2/1/2019 | 64 | 16 | $2,440 | $24.40 |
| 3/1/2019 | 51 | 13 | $2,950 | $29.50 |
| 4/1/2019 | 41 | 10 | $3,360 | $33.60 |
| 5/1/2019 | 33 | 8 | $3,690 | $36.90 |
| 6/1/2019 | 26 | 7 | $3,950 | $39.50 |
| 7/1/2019 | 21 | 5 | $4,160 | $41.60 |
| 8/1/2019 | 17 | 4 | $4,330 | $43.30 |
| 9/1/2019 | 14 | 3 | $4,470 | $44.70 |
| 10/1/2019 | 11 | 3 | $4,580 | $45.80 |
| 11/1/2019 | 9 | 2 | $4,670 | $46.70 |
| 12/1/2019 | 7 | 2 | $4,740 | $47.40 |
| 1/1/2020 | 6 | 1 | $4,800 | $48.00 |
| 2/1/2020 | 5 | 1 | $4,850 | $48.50 |
| 3/1/2020 | 4 | 1 | $4,890 | $48.90 |
| 4/1/2020 | 3 | 1 | $4,920 | $49.20 |
| 5/1/2020 | 2 | 1 | $4,940 | $49.40 |
| 6/1/2020 | 2 | 0 | $4,960 | $49.60 |
| 7/1/2020 | 1 | 1 | $4,970 | $49.70 |
| 8/1/2020 | 1 | 0 | $4,980 | $49.80 |
| 9/1/2020 | 1 | 0 | $4,990 | $49.90 |
| 10/1/2020 | 1 | 1 | $5,000 | $50.00 |
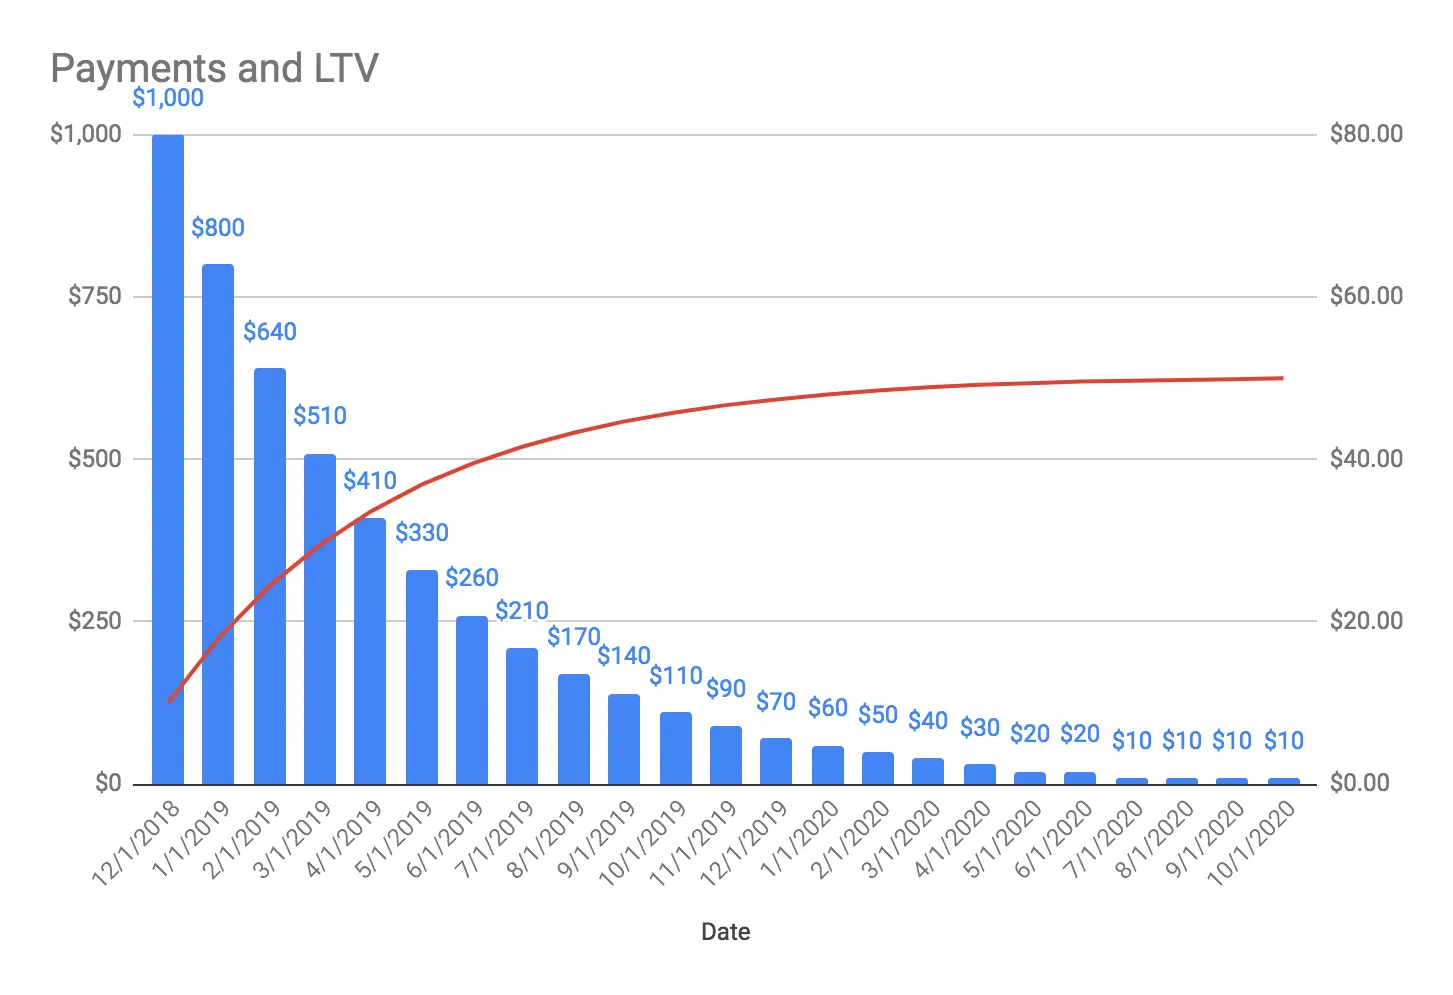
Dandy, right? We receive $50 per customer, so now I can allocate some of that to marketing, operations, and content licensing and keep the rest as our profit.
Well, sure, but if you actually did this, you would be underinvesting in your business. Because, in subscription-based businesses, the retention rate doesn’t actually follow average churn. Instead, what we see at Brightcove Audience Insights is that your new customers churn at a very high rate, often as much as 30-40% monthly churn over the first few billing cycles, while more tenured subscribers churn at a rate in the single digits.
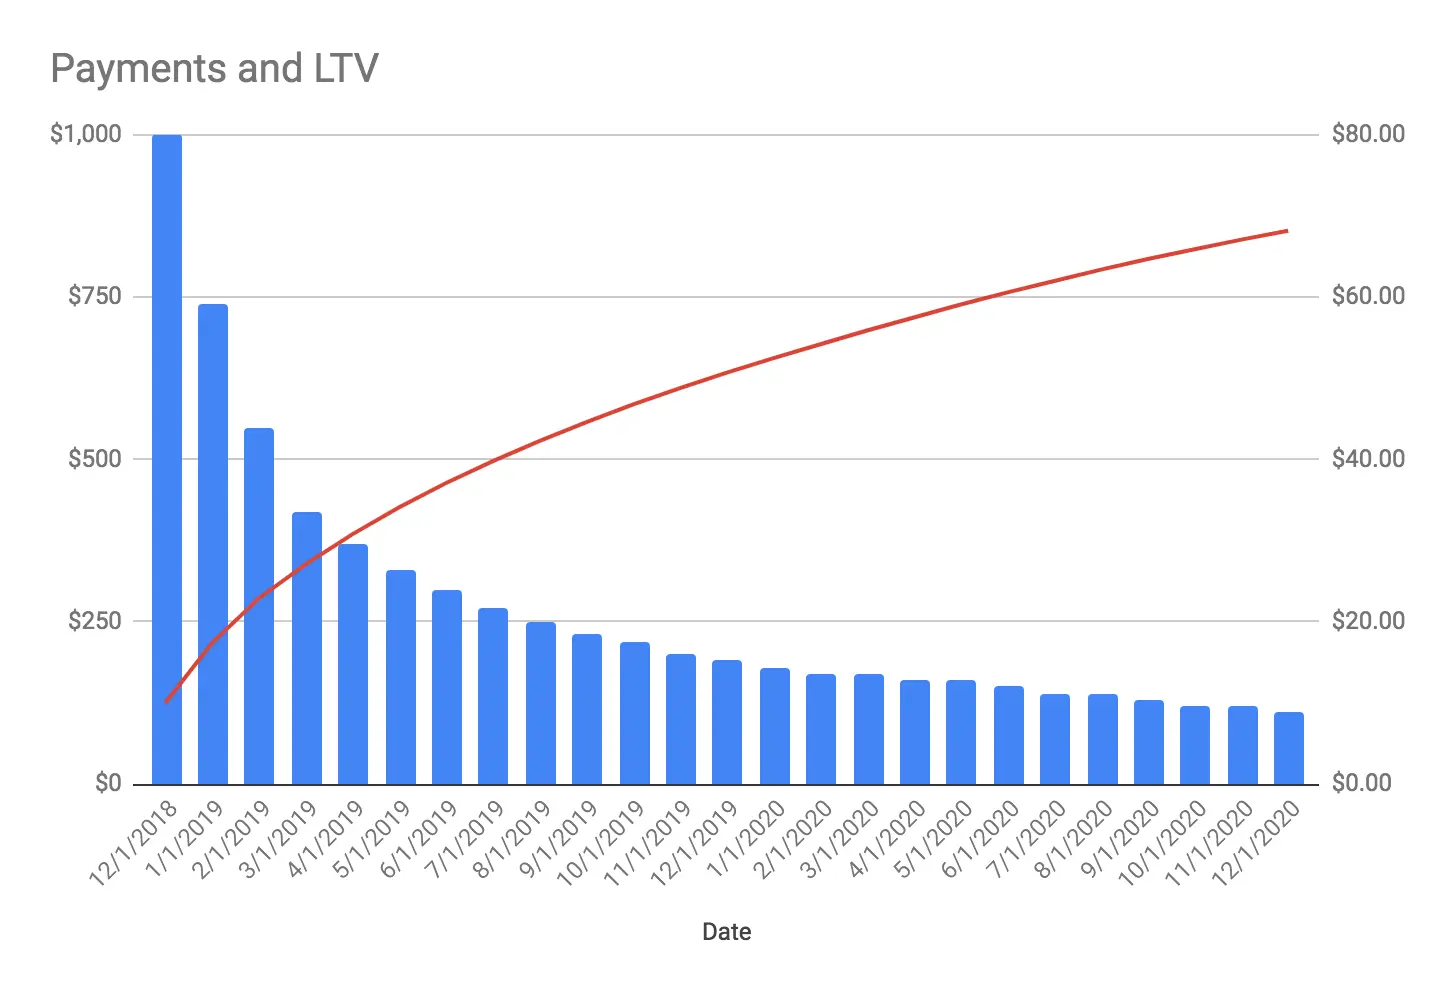
Fig. 2
However, the actual customer loss curve for our example company, PolarFlix, shows the LTV for this cohort of customers is $66 on October 1, 2020, with over ten customers still active. For a service with 100,000 subscribers, that’s a $1.6 million difference.
So, how do we make our formulas match our observed lifetime spending? We looked to academic marketing literature for the answer and find some great work that has been done by Peter Fader and Bruce Hardie. We’ve relied heavily on their work on CLV in contractual (i.e. renewing subscription) businesses. [ 1 ] Conceptually, this is pretty simple. We use historical data about our customers and create a retention curve. A retention curve shows the probability, as a value from 0 to 1, that a customer with a tenure of n days, will become a customer of tenure n+1 days. From that, it’s simple to show how much revenue we expect to receive. Mathematically, it’s more complicated, but that’s why we have computers!
With the Fader and Hardie method, we can even predict the curve beyond the longest tenure of our customers, something that Kaplan-Meier, a very common survival analysis method cannot do. There is an important caveat to this method, though! As you can see in the chart above, the curve may only reach 0 many, many years in the future. You have to choose some cutoff date for valuing these customers. Given the pace of change in our business, it’s safe to say your service isn’t going to be the same in 2038!
At Brightcove Audience Insights, we looked at the actual retention curves of our customers and choose to estimate LTV through 1,000 days of subscription. This allows 2 cycles of churn for annual subscriptions and, for typical churn rates, captures enough of the extra value from the long-tenured subscribers to make a material difference in the LTV.
An accurate LTV enables better investment
Now that you know a more accurate picture of your next customer’s payments, what will you do with this information?
An accurate LTV number lets you invest with confidence in acquiring more customers, license more content to address churn, or allows you to lower the price of your service to capture even more customers.
In addition, you can use LTV and churn measurements to compare natural segments of your customer base to understand what part of your customer base is healthy and which deserves additional investment. Given the advantages to the predictive model, we are upgrading the Insights Scorecard to base all LTV values on these retention curves. In future posts, we’ll discuss the implications on specific insights.
Footnotes
- A great starting point is their 2007 publication, How To Project Customer Retention