If there is one thing we have heard consistently from bigger, more sophisticated media companies that have in-house data and analytics teams, it’s that they’d like the ability to customize the Insights Scorecard to address their specific needs. They love our interface and pre-configured Insights, but want more flexibility. This has been a difficult challenge when a core value proposition of our product is that it is just that, a product, with careful curation and design of every insight and Insight.
We partially addressed this by offering our larger customers the ability to query their data via AWS Redshift. This unlocked the ability for our customers to explore their data to answer questions beyond what we present in the Scorecard. However this did not provide a way to visualize these new insights or share them in the context of the Scorecard. Our client services team really gave us the idea to address this, based on the requests that they were receiving to develop custom queries and reports.
Introducing Quickets
The name says it all. Quickets are essentially quick Insights. They are queries + visualizations that are easy to build and instantly share within our enterprise customers’ Insights Scorecards.
We have enabled this by leveraging the aforementioned ability to present our customers’ data in AWS Redshift and integrating Amazon’s QuickSight product, which is designed to work seamlessly with Redshift, into our Scorecard. By embedding QuickSight into our new Quickets tab, we can provide the following benefits:
- A new tab for custom insights. The Quickets tab is a place for both authors and viewers to interact with custom insights. Authors can define and publish as many insights as they like. Viewers can see only Quickets that have been published by Authors. Each customer Quickets page will have a few pre-configured Quickets that illustrate the value immediately.
- Synchronized permissions so that Scorecard admin users automatically have author accounts and those with Scorecard viewing credentials have viewer accounts created in QuickSight. We’ve enabled single sign-on, so users only have to login to the Insights Scorecard to gain access to the Quickets tab.
- A rich exploration/authoring environment by exposing our customers harmonized data to them through Redshift and QuickSight we provide them with the ability to explore an extensive universe of both simple and complex queries with a wide range of visualization choices. This includes the ability to do analysis before publishing to readers, which is the kind of sandbox that our customers have been asking for.
- A tool for our Customer Success Team to offer new insights to our customers ahead of our product roadmap.
This implementation enables four powerful use cases that will help our customers realize more value and help us identify new roadmap opportunities.
- User-selected time ranges with filters for simple analytics.
This presents a new level of flexibility in terms of custom date ranges coupled with the ability to drill into specific dimensions (e.g. device, channel, geography etc) that makes it really to answer very specific questions. - Row-level access to subscriber data.
When a customer wants to look up a specific subscriber and see their history, they currently need to use SQL client to access. - Custom methodologies for connecting with internal and previous reporting methods.
We often run into scenarios where our customers have used different definitions for some key metrics. Quickets enable customers to set up analogs to their prior/existing reporting system so that they can enjoy both the new views represented in the Insights Scorecard, and present tracking numbers that are familiar to constituents. - Prototyping Insights with Customers
Our customer success team will explore custom reports to investigate how effective they will be for customer decision making. For example, they might look at all the viewing of users in their first month of service and then use that in a promotion campaign. This allows us to build those in a reusable manner while we are still unsure of their efficacy.
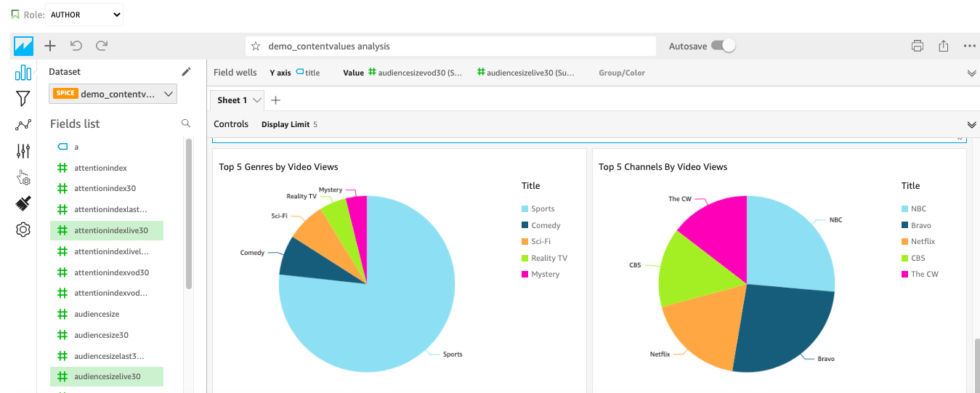
Below is a screenshot of the the authoring environment:
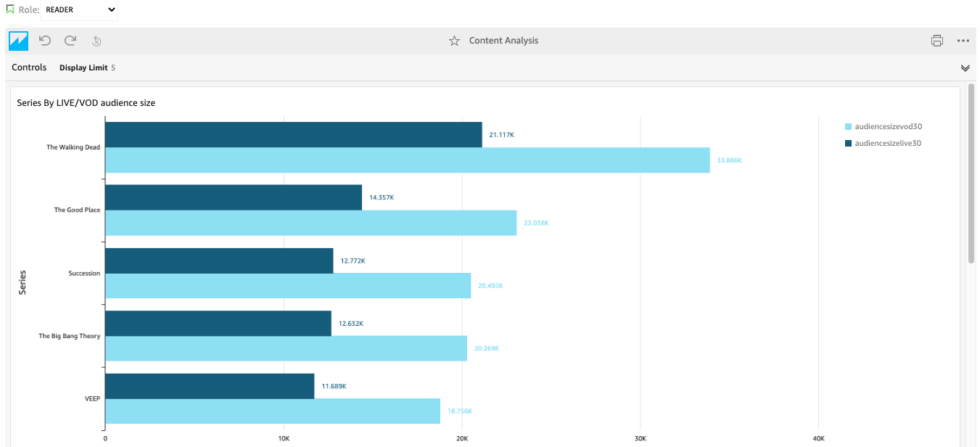
And here is a screenshot of a reader dashboard:
We are excited about this advancement in our product, and are confident that it will give our customers who want to explore beyond our Scorecard a way to find and share the custom insights they need.