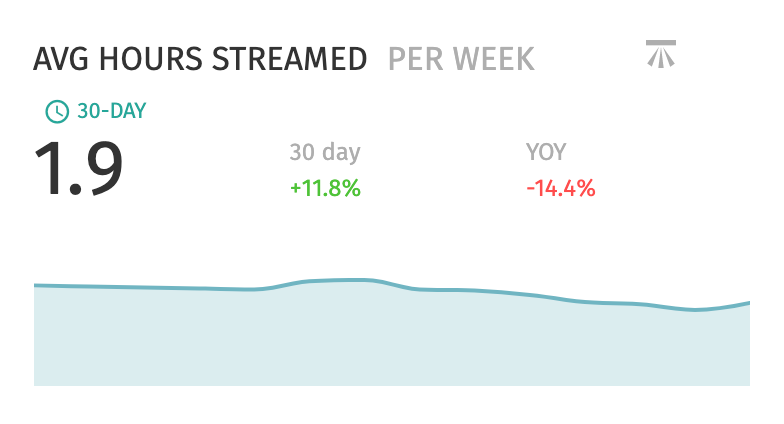
Average hours streamed
Subscriber loyalty is the holy grail for SVoD services. Having a great content offering is one of many ways to increase subscriber loyalty and pairing this with viewing data is a great strategy to win in a crowded market.
Avg Hours Streamed per week demonstrates how many hours are consumed each week on average for all paid subscribers with a comparison to the previous 28 days and year-over-year. This is another view into the loyalty of your average subscriber.
Keeping tabs on this metric is a great way for video services to check the pulse of their subscribers. Not only do you have access to the benchmark for Average Hours Streamed which allows you to compare your video service to your peers, but it also gives you quick indications if subscribers are engaging less with your service and allows you to dig into what could be causing this to lag.
Keep subscribers coming back by maintaining a library of content that appeals to the viewing habits of your audience. Utilize strategies to deepen their engagement with your video service by guiding them to further content that is likely to keep them engaged and subscribed for the long-term. Understanding this relationship between your subscribers and the content they love is paramount to building a personal experience that reduces their propensity to churn.